Dominion Power 2013 Annual Report Download - page 14
Download and view the complete annual report
Please find page 14 of the 2013 Dominion Power annual report below. You can navigate through the pages in the report by either clicking on the pages listed below, or by using the keyword search tool below to find specific information within the annual report.-
 1
1 -
2
-
3
-
 4
4 -
 5
5 -
 6
6 -
 7
7 -
 8
8 -
 9
9 -
 10
10 -
 11
11 -
 12
12 -
 13
13 -
 14
14 -
 15
15 -
 16
16 -
 17
17 -
 18
18 -
 19
19 -
 20
20 -
 21
21 -
 22
22
 |
 |

16 DOMINION RESOURCES, INC.
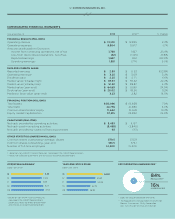
DOMINION FINANCIAL CHARTS
Source: Bloomberg (as of Dec. 31, 2013).
Percent / Through Dec. 31, 2013 Source: Bloomberg
1 Year Total Return 3 Year Total Return 5YearTotalReturn
Dominion Dow Jones Utility UTY S&P 500
29.65
70.56
124.33
12.74 11.04 32.36
37.08 31.59
56.70
64.32 53.16
128.04
−85% NOx
−94% SO2
−95% Hg
TARGETED DIVIDEND INCREASE*
Dollars Per Share
* All dividend declarations are subject to Board of
Directors approval.
10 11 12 13 14
1.97 2.11 2.25
1.83
2.40*
MARKET CAPITALIZATION
Electric & Gas Utilities (by NYSE ticker symbols)
Billions of Dollars
50
40
30
20
10
0DUK DNEE SO EXC AEP SRE PPL PCG PEG ED EIX XEL FE NU DTE ETR AES CNP WEC NRG AEE CPN CMS SCG PNW LNT ITC POM
37.6
DOMINION
RANKS
SECOND
IN MARKET
CAPITALIZATION
RELATIVE TO TOP
U.S. ELECTRIC & GAS
UTILITIES
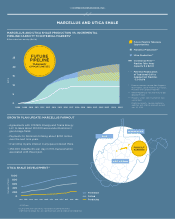
INFRASTRUCTURE INVESTMENT
Dollars in Billions
Cumulative Planned Growth Capital Expenditures*
* All planned expenditures are preliminary and
may be subject to regulatory and/or Board of
Directors approvals.
6.8
9.5
12.2
3.8
13.8
14 15 16 17 18
GROWTH PLAN BENEFITS COMMUNITIES
* All planned capital expenditures are based on the capital
expenditure plan reviewed and endorsed by Dominion’s
Board of Directors in late 2013. Dominion undertakes no
obligation to update this information to reflect plan or
project-specific developments, including regulatory
developments, or other updates until the next annual
update of the plan. Actual capital expenditures may be
subject to the Board of Directors approval and/or regulatory
approval and may vary from these estimates.
Growth: $27.6 billion*
Construction Jobs: 28,254
Local Property Tax Revenue: $519 million
Figures are estimated growth capital expenditures,
construction jobs and local taxes from 2007–2018.
CLEANER AIR IN VIRGINIA
Percent / Projected emissions reduction*
* 2013 Hg data is estimated.
Actual data available July 2014.
SO2 NOx Hg (Mercury)
−100
−80
−60
−40
−20
0
00 02 04 06 08 10 12 13 15 20
TOTAL RETURN COMPARISON