Dominion Power 2013 Annual Report Download - page 10
Download and view the complete annual report
Please find page 10 of the 2013 Dominion Power annual report below. You can navigate through the pages in the report by either clicking on the pages listed below, or by using the keyword search tool below to find specific information within the annual report.-
 1
1 -
 2
2 -
 3
3 -
 4
4 -
 5
5 -
 6
6 -
 7
7 -
 8
8 -
 9
9 -
 10
10 -
 11
11 -
 12
12 -
 13
13 -
 14
14 -
 15
15 -
 16
16 -
 17
17 -
 18
18 -
 19
19 -
 20
20 -
 21
21 -
22
 |
 |

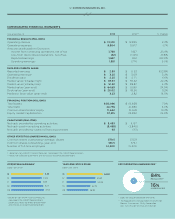
CONSOLIDATED FINANCIAL HIGHLIGHTS
OPERATING EARNINGS*
Dollars per Share
* Based on non-GAAP Financial Measures.
See page 22 for GAAP Reconciliations.
2009–2012 recast to reflect Brayton Point
and Kincaid as discontinued operations.
* Does not include Corporate and Other.
** The Regulated mix includes Electric Transmission,
Electric Distribution, Utility Generation,
Gas Transmission and Gas Distribution.
2013 OPERATING EARNINGS MIX*
REGULATED**
84%
UNREGULATED
16%
YEAR-END STOCK PRICE
Dollars per Share
Year ended Dec. 31, 2013 2012** % Change
FINANCIAL RESULTS (MILLIONS)
Operating revenue $13,120 $12,835 2.2%
Operating expenses 9,804 9,977 -1.7%
Amounts attributable to Dominion:
Income from continuing operations, net of tax 1,789 1,427 25.4%
Loss from discontinued operations, net of tax (92) (1,125) -91.8%
Reported earnings 1,697 302 461.9%
Operating earnings*1,881 1,774 6.0%
DATA PER COMMON SHARE
Reported earnings $2.93 $0.53 452.8%
Operating earnings*$3.25 $3.09 5.2%
Dividends paid $2.25 $2.11 6.6%
Market value (intraday high) $67.97 $55.62 22.2%
Market value (intraday low) $51.92 $48.87 6.2%
Market value (year-end) $64.69 $51.80 24.9%
Book value (year-end) $20.02 $18.34 9.2%
Market to book value (year-end) 3.23 2.82 14.5%
FINANCIAL POSITION (MILLIONS)
Total assets $50,096 $46,838 7.0%
Total debt 22,776 21,486 6.0%
Common shareholders’ equity 11,642 10,568 10.2%
Equity market capitalization 37,615 29,842 26.0%
CASH FLOWS (MILLIONS)
Net cash provided by operating activities $3,433 $4,137
Net cash used in investing activities (3,458) (3,840)
Net cash provided by (used in) financing activities 93 (151)
OTHER STATISTICS (SHARES IN MILLIONS)
Common shares outstanding –average, diluted 579.5 573.9
Common shares outstanding–year-end 581.5 576.1
Number of full-time employees 14,500 15,500
*Based on non-GAAP Financial Measures. See page 22 for GAAP Reconciliations.
** Recast to reflect Brayton Point and Kincaid as discontinued operations.
3.09
3.03
3.27
3.34
3.25
13
12
11
10
09
51.80
53.08
42.72
38.92
64.69
13
12
11
10
09
12 DOMINION RESOURCES, INC.