Dominion Power 2012 Annual Report Download - page 14
Download and view the complete annual report
Please find page 14 of the 2012 Dominion Power annual report below. You can navigate through the pages in the report by either clicking on the pages listed below, or by using the keyword search tool below to find specific information within the annual report.-
 1
1 -
2
-
3
-
 4
4 -
 5
5 -
 6
6 -
 7
7 -
 8
8 -
 9
9 -
 10
10 -
 11
11 -
 12
12 -
 13
13 -
 14
14 -
 15
15 -
 16
16 -
 17
17 -
 18
18 -
 19
19 -
 20
20 -
 21
21 -
 22
22
 |
 |

Dominion Resources 2012 Summary Annual Report16
DOMINION FINANCIAL CHARTS
54% 46% 65–75%
25–35% 20% 10–20%
*Does not include Corporate and Other. Data is prior to recast. See page 22 for GAAP Reconciliations.
Business Model Refinement
Operating Earnings Mix*
2013+ Target Mix2006 Actual 2012 Actual
2009 Target Mix
Unregulated Regulated Unregulated Regulated Unregulated
80%
Regulated Unregulated
80–90%
Regulated
Dominion Dow Jones Utility DJIA S&P 500
Total Return Comparison Percent/ThroughDec.31,2012 Source: Bloomberg
1 Year Total Return 3 Year Total Return 5 Year Total Return
Targeted Dividend Increase*
Dollars Per Share
*All dividend declarations are subject to
Board of Directors approval.
09 10 11 12 13
1.83 1.97 2.11
1.75 2.25*
Regulated Infrastructure Investment
Dollars in Billions
Cumulative Planned Growth Capital Expenditures*
*All planned expenditures are preliminary and
may be subject to regulatory and/or Board of
Directors approvals.
4.7 6.4 8.52.2 10.7
13 14 15 16 17
Cleaner Air in Virginia
Percent / Projected emissions reduction*
*2012 Hg data estimate. Actual data available July 1.
SO²NOx Hg −84% NOx
−91% Hg (Mercury)
−94% SO²
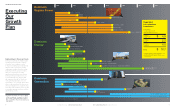
Growth Plan Benefits Communities
*All planned capital expenditures are based on the capital
expenditure plan reviewed and endorsed by Dominion’s
Board of Directors in late 2012, adjusted for the Cove Point
project and other Energy-related projects. Dominion
undertakes no obligation to update this information
to reflect plan or project-specific developments, including
regulatory developments, or other updates until the next
annual update of the plan. Actual capital expenditures
may be subject to the Board of Directors approval and/or
regulatory approval and may vary from these estimates.
Growth: $24.6 billion
Construction Jobs: 26,444
Local Property Tax Revenue: $403 million
Figures are estimated growth capital expenditures,
construction jobs, and local tax revenue from 2007–17.
*
−100
−80
−60
−40
−20
0
00 02 04 06 08 10 12 15 20
1.65
51.08
35.76
1.35
29.13
4.85 10.23
36.26
13.82 15.99
36.27
8.59