Dominion Power 2004 Annual Report Download - page 7
Download and view the complete annual report
Please find page 7 of the 2004 Dominion Power annual report below. You can navigate through the pages in the report by either clicking on the pages listed below, or by using the keyword search tool below to find specific information within the annual report.-
 1
1 -
 2
2 -
 3
3 -
 4
4 -
 5
5 -
 6
6 -
 7
7 -
 8
8 -
 9
9 -
 10
10 -
 11
11 -
 12
12 -
 13
13 -
 14
14 -
 15
15 -
 16
16 -
 17
17 -
 18
18 -
19
-
20
-
21
-
22
-
23
-
24
-
25
-
26
-
27
-
28
-
29
-
30
-
31
-
32
-
33
-
34
-
35
-
36
-
37
-
38
-
39
-
40
-
41
-
42
-
43
-
44
-
45
-
46
-
47
-
48
-
49
-
50
-
51
-
52
-
53
-
54
-
55
-
56
-
57
-
58
-
59
-
60
-
61
-
62
-
63
-
64
-
65
-
66
-
67
-
68
-
69
-
70
-
71
-
72
-
73
-
74
-
75
-
76
-
77
-
78
-
79
-
80
-
81
-
82
-
83
-
84
-
85
-
86
-
87
-
88
-
89
-
90
-
91
-
92
-
93
-
94
-
95
-
96
-
97
-
98
-
99
-
100
-
101
-
102
-
103
-
104
 |
 |

D 2004/Page 5
If you’ve invested with us over the
long haul, you know we don’t
like bandwagons, don’t do fads and
aren’t wired to make fashionable
short-term plays.
Instead, we’ve spent the last five
years building a steadily profitable plat-
form of integrated electric power and
natural gas businesses. They serve the
energy-hungry mid-Atlantic, Midwest and
Northeast. We’ve hedged our bets and—
thanks to our tireless, energetic and
innovative employees—have achieved
superior levels of efficiency, safety and
environmental responsibility. These
results reflect our embedded values. The
businesses we’ve joined together are
widely recognized by investors and indus-
try analysts for their quality and earnings
stability.
5-Year Total Return In Excess of
115 Percent
In truth, it has been a hard labor of love,
and a successful one. Our five-year com-
pounded total return to investors stood at
more than 115 percent on the last trading
day of 2004. Thank you for your contin-
ued confidence and capital.
This measure of shareholder wealth,
including dividends and share apprecia-
tion, contrasts dramatically with a total
return by the S&P 500 of negative 11
percent. It easily tops respective returns
of 70 percent and negative 3 percent by
the S&P electric and natural gas indexes
over the same period. A $100 investment
in Dominion stock on the first day of
2000 was worth $215 at the end of 2004,
including reinvested dividends.
But as an investor, you rightly ask,
“What have you done for us lately?”
Let’s first review the basics—earn-
ings, dividends and free cash flow—
before turning to the broader issues of
interest to the long-term investor.
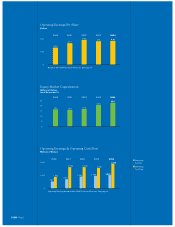
Higher Earnings, Bigger Dividend
and Positive Free Cash Flow
In 2004 we reported earnings of $3.78
per share under Generally Accepted
Accounting Principles (GAAP) compared
to $1.00 per share under GAAP in 2003.
We generated 2004 operating earnings,
excluding certain items, of $4.61 per
share, a slight increase over 2003
operating earnings of $4.55 per share.
You can find the differences between our
operating and GAAP earnings reconciled
in a chart on page 24.
Looking ahead, we’ve set 2005 earn-
ings targets of $5.00 to $5.10 per share.
When we report our 2005 earnings under
GAAP, this target operating range may
exclude items we can’t yet quantify or
predict, and will exclude one item noted
on page 25.
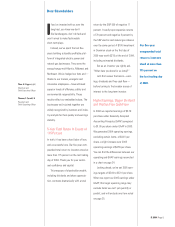
Dear Shareholders
Our five-year
compounded total
return to investors
stood at more than
115 percent on
the last trading day
of 2004.
Thos. E. Capps (right)
Chairman and
Chief Executive Officer
Thomas F. Farrell, II
President and
Chief Operating Officer