Dominion Power 2004 Annual Report Download - page 5
Download and view the complete annual report
Please find page 5 of the 2004 Dominion Power annual report below. You can navigate through the pages in the report by either clicking on the pages listed below, or by using the keyword search tool below to find specific information within the annual report.-
 1
1 -
 2
2 -
 3
3 -
 4
4 -
 5
5 -
 6
6 -
 7
7 -
 8
8 -
 9
9 -
 10
10 -
 11
11 -
 12
12 -
 13
13 -
 14
14 -
 15
15 -
 16
16 -
17
-
18
-
19
-
20
-
21
-
22
-
23
-
24
-
25
-
26
-
27
-
28
-
29
-
30
-
31
-
32
-
33
-
34
-
35
-
36
-
37
-
38
-
39
-
40
-
41
-
42
-
43
-
44
-
45
-
46
-
47
-
48
-
49
-
50
-
51
-
52
-
53
-
54
-
55
-
56
-
57
-
58
-
59
-
60
-
61
-
62
-
63
-
64
-
65
-
66
-
67
-
68
-
69
-
70
-
71
-
72
-
73
-
74
-
75
-
76
-
77
-
78
-
79
-
80
-
81
-
82
-
83
-
84
-
85
-
86
-
87
-
88
-
89
-
90
-
91
-
92
-
93
-
94
-
95
-
96
-
97
-
98
-
99
-
100
-
101
-
102
-
103
-
104
 |
 |

D 2004/Page 3
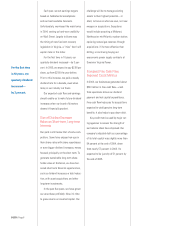
10.5
28.0
115.6
24.2
9.7
20.0 26.5 33.2
70.5
10.9 11.1
(11.0)
1 Year Total Return 3 Year Total Return 5 Year Total Return
Total Return Comparison
Percent
As of December 31, 2004
Dominion S&P Utilities S&P Electric S&P 500
120
100
80
60
40
20
0
-20
Based on Bloomberg.
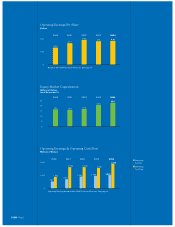
36.0
39.2
43.5
Assets
Billions of Dollars
20022001
30.4
2000 2003
45.4
2004
50
25
0
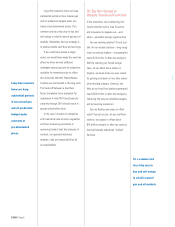
2.60
Dividend is more than
covered by regulated /
tariff-based earnings
Hedged unregulated earnings
provide additional coverage 54% from
regulated /
tariff-based
Unhedged
Unregulated
Hedged
Unregulated
Regulated
Tariff-based
*Based on Non-GAAP Financial Measures. See pages 24 and 25.
** Operating segments' net income as adjusted by adding back depreciation, depletion
and amortization.
VEPCO-Reg
35%
CNG -Reg
19%
CNG/DEI -E&P
38%
DEI-Non Reg
8%
Dividend Operating
Cash Flow
Sources**
2004
Operating
Earnings*
Dividend Coverage
Dollars Per Share
6.00
3.00
0.00