Dollar General 2010 Annual Report Download - page 84
Download and view the complete annual report
Please find page 84 of the 2010 Dollar General annual report below. You can navigate through the pages in the report by either clicking on the pages listed below, or by using the keyword search tool below to find specific information within the annual report.-
 1
1 -
2
-
3
-
4
-
5
-
6
-
7
-
8
-
9
-
10
-
11
-
12
-
13
-
14
-
15
-
16
-
17
-
18
-
19
-
20
-
21
-
22
-
23
-
24
-
25
-
26
-
27
-
28
-
29
-
30
-
31
-
32
-
33
-
34
-
35
-
36
-
37
-
38
-
39
-
40
-
41
-
42
-
43
-
44
-
45
-
46
-
47
-
48
-
49
-
50
-
51
-
52
-
53
-
54
-
55
-
56
-
57
-
58
-
59
-
60
-
61
-
62
-
63
-
64
-
65
-
66
-
67
-
68
-
69
-
70
-
71
-
72
-
73
-
 74
74 -
 75
75 -
 76
76 -
 77
77 -
 78
78 -
 79
79 -
 80
80 -
 81
81 -
 82
82 -
 83
83 -
 84
84 -
 85
85 -
 86
86 -
 87
87 -
 88
88 -
 89
89 -
 90
90 -
 91
91 -
 92
92 -
 93
93 -
 94
94 -
95
-
96
-
97
-
98
-
99
-
100
-
101
-
102
-
103
-
104
-
105
-
106
-
107
-
108
-
109
-
110
-
111
-
112
-
113
-
114
-
115
-
116
-
117
-
118
-
119
-
120
-
121
-
122
-
123
-
124
-
125
-
126
-
127
-
128
-
129
-
130
-
131
-
132
-
133
-
134
-
135
-
136
-
137
-
138
-
139
-
140
-
141
-
142
-
143
-
144
-
145
-
146
-
147
-
148
-
149
-
150
-
151
-
152
-
153
-
154
-
155
-
156
-
157
-
158
-
159
-
160
-
161
-
162
-
163
-
164
-
165
-
166
-
167
-
168
-
169
-
170
-
171
-
172
-
173
-
174
-
175
-
176
-
177
-
178
-
179
-
180
-
181
-
182
-
183
-
184
-
185
-
186
-
187
-
188
-
189
-
190
-
191
-
192
-
193
-
194
-
195
-
196
 |
 |

10-K
The Dollar General Store
The average Dollar General store has approximately 7,200 square feet of selling space and is
typically operated by a manager, an assistant manager and three or more sales clerks. Approximately
58% of our stores are in freestanding buildings, 41% in strip shopping centers and 1% are in
downtown buildings. Most of our customers live within three to five miles, or a 10 minute drive, of our
stores. Our store strategy features low initial capital expenditures, limited maintenance capital, low
occupancy and operating costs, and a focused merchandise offering within a broad range of categories,
allowing us to deliver low retail prices while generating strong cash flows and investment returns. In
2010, the average cost of equipment and fixtures in our leased stores was approximately $165,000.
Initial inventory, net of payables, increases the investment in a new store by approximately $75,000.
We generally have not encountered difficulty locating suitable store sites in the past. Given the size
of the communities that we target, we believe that there is ample opportunity for new store growth in
existing and new markets. In addition, the current real estate market is providing an opportunity for us
to access higher quality sites at lower rates than in recent years. Also, we believe we have significant
opportunities available for our relocation and remodel programs. We spend approximately $75,000 for
equipment and fixtures to remodel a store and approximately $140,000 to relocate one. We remodeled
or relocated 504 stores in 2010, 450 in 2009 and 404 in 2008.
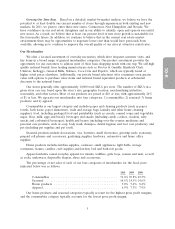
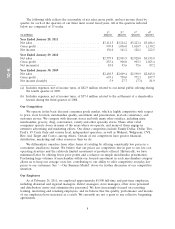
Our recent store growth is summarized in the following table:
Stores at Net
Beginning Stores Stores Store Stores at
Year of Year Opened Closed Increase/(Decrease) End of Year
2008 ................. 8,194 207 39 168 8,362
2009 ................. 8,362 500 34 466 8,828
2010 ................. 8,828 600 56 544 9,372
Our Customers
Our customers seek value and convenience. Depending on their financial situation and geographic
proximity, customers’ reliance on Dollar General varies from fill-in shopping to periodic routine trips in
order to stock up on household items, to weekly or more frequent trips to meet most essential needs.
We believe that our value and convenience proposition attracts customers from a wide range of income
brackets and life stages. In the last year, we have seen increases in the annual number of shopping trips
that our customers make to Dollar General as well as the amount spent during each trip.
We continue to focus on the quality, selection and pricing of our merchandise, targeted advertising,
improved store standards and site selection processes, among other initiatives, to attract new and retain
existing customers.
Our Suppliers
We purchase merchandise from a wide variety of suppliers and maintain direct buying relationships
with many producers of national brand merchandise, such as Procter & Gamble, Kimberly Clark,
Unilever, Kellogg’s, General Mills, Nabisco, Coca-Cola and PepsiCo. Despite our broad offering, we
maintain only a limited number of SKUs per category, giving us a pricing advantage in dealing with our
suppliers. Approximately 9% and 7% of our purchases in 2010 were from our largest and second
largest suppliers, respectively. Our private brands come from a diversified supplier base. We directly
imported approximately 8% of our purchases at cost (13% of our purchases at retail) in 2010. Our
vendor arrangements generally provide for payment for such merchandise in U.S. dollars.
We have not experienced any difficulty in obtaining sufficient quantities of core merchandise and
believe that, if one or more of our current sources of supply became unavailable, we would generally be
6