Dollar General 2010 Annual Report Download - page 166
Download and view the complete annual report
Please find page 166 of the 2010 Dollar General annual report below. You can navigate through the pages in the report by either clicking on the pages listed below, or by using the keyword search tool below to find specific information within the annual report.-
 1
1 -
2
-
3
-
4
-
5
-
6
-
7
-
8
-
9
-
10
-
11
-
12
-
13
-
14
-
15
-
16
-
17
-
18
-
19
-
20
-
21
-
22
-
23
-
24
-
25
-
26
-
27
-
28
-
29
-
30
-
31
-
32
-
33
-
34
-
35
-
36
-
37
-
38
-
39
-
40
-
41
-
42
-
43
-
44
-
45
-
46
-
47
-
48
-
49
-
50
-
51
-
52
-
53
-
54
-
55
-
56
-
57
-
58
-
59
-
60
-
61
-
62
-
63
-
64
-
65
-
66
-
67
-
68
-
69
-
70
-
71
-
72
-
73
-
74
-
75
-
76
-
77
-
78
-
79
-
80
-
81
-
82
-
83
-
84
-
85
-
86
-
87
-
88
-
89
-
90
-
91
-
92
-
93
-
94
-
95
-
96
-
97
-
98
-
99
-
100
-
101
-
102
-
103
-
104
-
105
-
106
-
107
-
108
-
109
-
110
-
111
-
112
-
113
-
114
-
115
-
116
-
117
-
118
-
119
-
120
-
121
-
122
-
123
-
124
-
125
-
126
-
127
-
128
-
129
-
130
-
131
-
132
-
133
-
134
-
135
-
136
-
137
-
138
-
139
-
140
-
141
-
142
-
143
-
144
-
145
-
146
-
147
-
148
-
149
-
150
-
151
-
152
-
153
-
154
-
155
-
 156
156 -
 157
157 -
 158
158 -
 159
159 -
 160
160 -
 161
161 -
 162
162 -
 163
163 -
 164
164 -
 165
165 -
 166
166 -
 167
167 -
 168
168 -
 169
169 -
 170
170 -
 171
171 -
 172
172 -
 173
173 -
 174
174 -
 175
175 -
 176
176 -
177
-
178
-
179
-
180
-
181
-
182
-
183
-
184
-
185
-
186
-
187
-
188
-
189
-
190
-
191
-
192
-
193
-
194
-
195
-
196
 |
 |

10-K
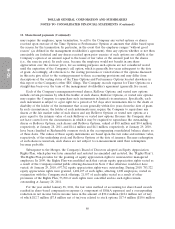
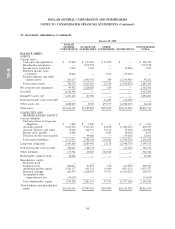
DOLLAR GENERAL CORPORATION AND SUBSIDIARIES
NOTES TO CONSOLIDATED FINANCIAL STATEMENTS (Continued)
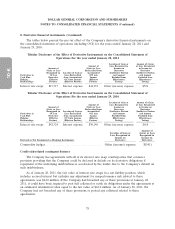
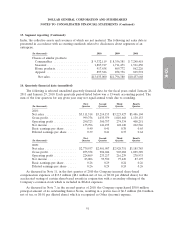
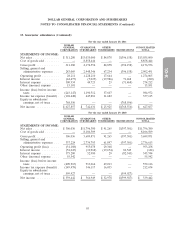
11. Share-based payments (Continued)
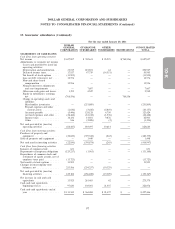
At January 28, 2011, 53,434 Rollover Options were outstanding, all of which were exercisable. The
aggregate intrinsic value of these outstanding Rollover Options was $1.4 million with a weighted
average remaining contractual term of 4.3 years, and a weighted average exercise price of $2.1875.
A summary of Time Options activity during the period ended January 28, 2011 is as follows:
Remaining
Options Average Contractual Intrinsic
(Intrinsic value amounts reflected in thousands) Issued Exercise Price Term in Years Value
Balance, January 29, 2010 .................... 6,123,052 $ 8.68
Granted ................................ 348,784 27.39
Exercised ................................ (342,293) 8.15
Canceled ................................ (351,412) 10.53
Balance, January 28, 2011 .................... 5,778,131 $ 9.73 7.3 $108,104
Vested or expected to vest at January 28, 2011 ..... 5,491,477 $ 9.55 7.2 $103,695
Exercisable at January 28, 2011 ................ 2,773,235 $ 8.31 7.0 $ 55,706
The weighted average grant date fair value of Time Options granted during 2010, 2009 and 2008
was $12.61, $6.73 and $4.17, respectively.
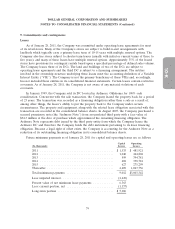
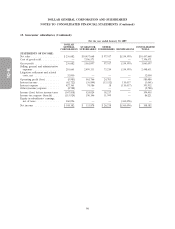
A summary of Performance Options activity during the period ended January 28, 2011 is as
follows:
Remaining
Options Average Contractual Intrinsic
(Intrinsic value amounts reflected in thousands) Issued Exercise Price Term in Years Value
Balance, January 29, 2010 .................... 6,251,623 $ 8.67
Granted ................................ 348,784 27.39
Exercised ................................ (777,249) 8.13
Canceled ................................ (326,134) 10.58
Balance, January 28, 2011 .................... 5,497,024 $ 9.82 7.3 $102,369
Vested or expected to vest at January 28, 2011 ..... 5,198,923 $ 9.62 7.3 $ 97,838
Exercisable at January 28, 2011 ................ 3,426,809 $ 8.68 7.0 $ 67,597
The weighted average grant date fair value of Performance Options granted was $12.61, $6.73 and
$4.17 during 2010, 2009 and 2008, respectively.
In April 2010, the Company granted 100,000 options to its Chief Executive Officer with an exercise
price of $29.38 and a vesting period of one year from the date of grant.
The total intrinsic value of all stock options repurchased by the Company under terms of the
management stockholders’ agreements during 2010, 2009 and 2008 was $0.1 million, $0.8 million and
$2.5 million, respectively.
At January 28, 2011, the total unrecognized compensation cost related to non-vested stock options
was $30.8 million with an expected weighted average expense recognition period of 2.8 years.
88