Dollar General 2010 Annual Report Download - page 105
Download and view the complete annual report
Please find page 105 of the 2010 Dollar General annual report below. You can navigate through the pages in the report by either clicking on the pages listed below, or by using the keyword search tool below to find specific information within the annual report.-
 1
1 -
2
-
3
-
4
-
5
-
6
-
7
-
8
-
9
-
10
-
11
-
12
-
13
-
14
-
15
-
16
-
17
-
18
-
19
-
20
-
21
-
22
-
23
-
24
-
25
-
26
-
27
-
28
-
29
-
30
-
31
-
32
-
33
-
34
-
35
-
36
-
37
-
38
-
39
-
40
-
41
-
42
-
43
-
44
-
45
-
46
-
47
-
48
-
49
-
50
-
51
-
52
-
53
-
54
-
55
-
56
-
57
-
58
-
59
-
60
-
61
-
62
-
63
-
64
-
65
-
66
-
67
-
68
-
69
-
70
-
71
-
72
-
73
-
74
-
75
-
76
-
77
-
78
-
79
-
80
-
81
-
82
-
83
-
84
-
85
-
86
-
87
-
88
-
89
-
90
-
91
-
92
-
93
-
94
-
 95
95 -
 96
96 -
 97
97 -
 98
98 -
 99
99 -
 100
100 -
 101
101 -
 102
102 -
 103
103 -
 104
104 -
 105
105 -
 106
106 -
 107
107 -
 108
108 -
 109
109 -
 110
110 -
 111
111 -
 112
112 -
 113
113 -
 114
114 -
 115
115 -
116
-
117
-
118
-
119
-
120
-
121
-
122
-
123
-
124
-
125
-
126
-
127
-
128
-
129
-
130
-
131
-
132
-
133
-
134
-
135
-
136
-
137
-
138
-
139
-
140
-
141
-
142
-
143
-
144
-
145
-
146
-
147
-
148
-
149
-
150
-
151
-
152
-
153
-
154
-
155
-
156
-
157
-
158
-
159
-
160
-
161
-
162
-
163
-
164
-
165
-
166
-
167
-
168
-
169
-
170
-
171
-
172
-
173
-
174
-
175
-
176
-
177
-
178
-
179
-
180
-
181
-
182
-
183
-
184
-
185
-
186
-
187
-
188
-
189
-
190
-
191
-
192
-
193
-
194
-
195
-
196
 |
 |

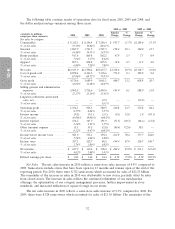
10-K
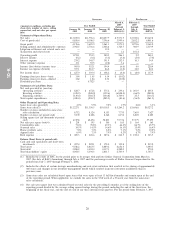
through July 6, 2007, average selling square footage was calculated using the average square footage as of July 6, 2007 and
as of the end of each of the four preceding quarters.
Successor Predecessor
March 6, February 3,
2007 2007
Year Ended Year Ended
through through
January 28, January 29, January 30, February 1, July 6, February 2,
2011 2010 2009 2008 2007 2007
Ratio of earnings to fixed
charges(1): .............. 3.1x 2.1x 1.4x (2) 1.1x 2.5x
(1) For purposes of computing the ratio of earnings to fixed charges, (a) earnings consist of income (loss) before income
taxes, plus fixed charges less capitalized expenses related to indebtedness (amortization expense for capitalized interest
is not significant) and (b) fixed charges consist of interest expense (whether expensed or capitalized), the amortization
of debt issuance costs and discounts related to indebtedness, and the interest portion of rent expense.
(2) For the Successor period from March 6, 2007 through February 1, 2008, fixed charges exceeded earnings by
$6.6 million.
ITEM 7. MANAGEMENT’S DISCUSSION AND ANALYSIS OF FINANCIAL CONDITION AND
RESULTS OF OPERATIONS
This discussion and analysis should be read with, and is qualified in its entirety by, the Consolidated
Financial Statements and the notes thereto. It also should be read in conjunction with the Cautionary
Disclosure Regarding Forward-Looking Statements and the Risk Factors disclosures set forth in the
Introduction and in Item 1A of this report, respectively.
Executive Overview
We are the largest discount retailer in the United States by number of stores, with 9,414 stores
located in 35 states as of February 25, 2011, primarily in the southern, southwestern, midwestern and
eastern United States. We offer a broad selection of merchandise, including consumable products such
as food, paper and cleaning products, health and beauty products and pet supplies, and
non-consumable products such as seasonal merchandise, home decor and domestics, and apparel. Our
merchandise includes high quality national brands from leading manufacturers, as well as comparable
quality private brand selections with prices at substantial discounts to national brands. We offer our
customers these national brand and private brand products at everyday low prices (typically $10 or less)
in our convenient small-box (small store) locations.
On July 6, 2007, we completed a merger and, as a result, we are majority owned by Buck
Holdings, L.P. (‘‘Buck’’), a Delaware limited partnership controlled by investment funds affiliated with
Kohlberg Kravis Roberts & Co. L.P. (collectively, ‘‘KKR’’). The membership interests of Buck and Buck
Holdings, LLC (‘‘Buck LLC’’), the general partner of Buck, are held by a private investor group,
including affiliates of each of KKR and Goldman, Sachs & Co. and other equity investors (collectively,
the ‘‘Investors’’). The merger consideration was funded through the use of our available cash, cash
equity contributions from the Investors, equity contributions of certain members of our management
and certain debt financings discussed below under ‘‘Liquidity and Capital Resources.’’ In November
2009, we completed an initial public offering of approximately 39.2 million shares, including
22.7 million newly issued shares and approximately 16.5 million outstanding shares sold by Buck. In
April and December of 2010, we completed secondary offerings of approximately 29.9 million and
28.8 million shares, respectively, all of which were sold by selling shareholders. We did not receive any
proceeds from either of the secondary offerings in 2010.
The customers we serve are value-conscious, and Dollar General has always been intensely focused
on helping our customers make the most of their spending dollars. We believe our convenient store
format and broad selection of high quality products at compelling values have driven our substantial
growth and financial success over the years. Like other companies, we have been operating in an
27