Discover 2010 Annual Report Download - page 6
Download and view the complete annual report
Please find page 6 of the 2010 Discover annual report below. You can navigate through the pages in the report by either clicking on the pages listed below, or by using the keyword search tool below to find specific information within the annual report.-
 1
1 -
 2
2 -
 3
3 -
 4
4 -
 5
5 -
 6
6 -
 7
7 -
 8
8 -
 9
9 -
 10
10 -
 11
11 -
 12
12 -
 13
13 -
 14
14 -
 15
15 -
 16
16 -
 17
17 -
18
-
19
-
20
-
21
-
22
-
23
-
24
-
25
-
26
-
27
-
28
-
29
-
30
-
31
-
32
-
33
-
34
-
35
-
36
-
37
-
38
-
39
-
40
-
41
-
42
-
43
-
44
-
45
-
46
-
47
-
48
-
49
-
50
-
51
-
52
-
53
-
54
-
55
-
56
-
57
-
58
-
59
-
60
-
61
-
62
-
63
-
64
-
65
-
66
-
67
-
68
-
69
-
70
-
71
-
72
-
73
-
74
-
75
-
76
-
77
-
78
-
79
-
80
-
81
-
82
-
83
-
84
-
85
-
86
-
87
-
88
-
89
-
90
-
91
-
92
-
93
-
94
-
95
-
96
-
97
-
98
-
99
-
100
-
101
-
102
-
103
-
104
-
105
-
106
-
107
-
108
-
109
-
110
-
111
-
112
-
113
-
114
-
115
-
116
-
117
-
118
-
119
-
120
-
121
-
122
-
123
-
124
-
125
-
126
-
127
-
128
-
129
-
130
-
131
-
132
-
133
-
134
-
135
-
136
-
137
-
138
-
139
-
140
-
141
-
142
-
143
-
144
-
145
-
146
-
147
-
148
-
149
-
150
-
151
-
152
-
153
-
154
-
155
-
156
-
157
-
158
-
159
-
160
-
161
-
162
-
163
-
164
-
165
-
166
-
167
-
168
-
169
-
170
-
171
-
172
-
173
-
174
-
175
-
176
-
177
-
178
-
179
-
180
-
181
-
182
-
183
-
184
-
185
 |
 |

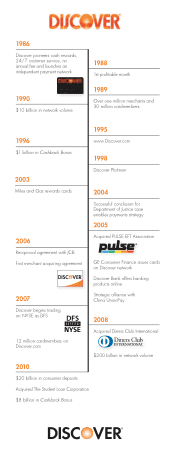
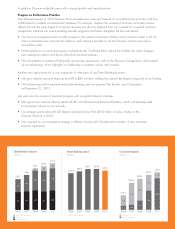
Total Network Volume
[Billions]
Direct Banking Loans*
[Billions]
2006 2007 2008 2009 2010
$45.8 $48.2 $51.1 $50.9
*2006–2009 as adjusted
Consumer Deposits
[Billions]
2006 2007 2008 2009 2010
$28.4
$32.0
$34.3
$24.6
$13.2
Diners Club International
$48.8
Brokered
Direct-to-ConsumerPULSE
Discover Network
2006
$163
93
70
2007
$186
99
86
2010
$248
103
118
27
2009
$232
97
109
26
2008
$221
102
106
13
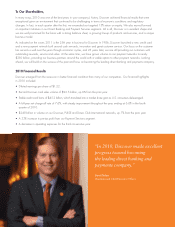
In addition, Discover ended the year with a strong liquidity and capital position.
Progress on Performance Priorities
We achieved success in 2010 because Discover employees were very focused on our performance priorities, and they
collaborated on multiple cross-functional initiatives. For example, I believe the increase in Discover card sales volume
reflects not only the early stages of economic recovery, but also the payback from our investments to expand merchant
acceptance, enhance our industry-leading rewards programs and further strengthen the Discover brand.
and we activated more international outlets as well, making it possible to use the Discover card at more places
around the world.
Cashback Bonus during the holidays for online shoppers,
new redemption options and bonus offers from merchant partners.
up our advertising, which highlights our leadership in customer service and rewards.
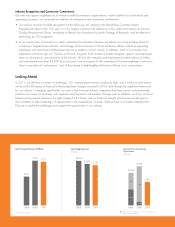
Another very high priority for us was expansion of other parts of our Direct Banking business.
Last year was also a year of important progress with our global network initiatives.
to transaction volume on our networks.
Discover Network in 2010.
acquirer agreements.
2.6 3.4 6.1
12.6
20.6
10.6
21.2
22.3
19.4
13.7