Digital River 2003 Annual Report Download - page 2
Download and view the complete annual report
Please find page 2 of the 2003 Digital River annual report below. You can navigate through the pages in the report by either clicking on the pages listed below, or by using the keyword search tool below to find specific information within the annual report.-
 1
1 -
 2
2 -
 3
3 -
 4
4 -
 5
5 -
 6
6 -
 7
7 -
 8
8
 |
 |

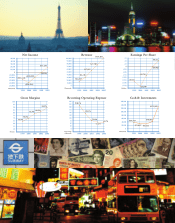
20032002200120001999
10,000
(10,000)
0
20,000
(20,000)
30,000
(30,000)
40,000
(40,000)
50,000
Thousands
($510)
(50,000)
($27,653)
($38,116)
($19,222)
$17,136
Net Income
20032002200120001999
80
70
75
85
65
90
60
95
55
100
Percent
50
70.0%
77.7%
84.3%
63.9%
82.3%
Gross Margins
20032002200120001999
(.25)
(.75)
(.50)
0
(1.00)
.25
(1.25)
.50
(1.50)
.75
Dollars
(1.75)
($0.02)
$0.52
($1.36)
($0.79)
($1.78)
Earnings Per Share
20032002200120001999
Thousands
0
20,000
40,000
80,000
100,000
60,000
120,000
140,000
160,000
$131,922
$40,801
$31,655
$31,897
$39,507
Cash & Investments
20032002200120001999
60,000
40,000
50,000
70,000
30,000
80,000
20,000
90,000
10,000
100,000
Thousands
0
$101,201
$77,783
$57,825
$31,181
$14,507
Revenue
20032002200120001999
150
125
125
175
75
200
50
225
25
250
Percentage
of Revenue
0
75.0% 55.7%
65.2%
139.1%
218.1%
Recurring Operating Expense