Dick's Sporting Goods 2006 Annual Report Download - page 2
Download and view the complete annual report
Please find page 2 of the 2006 Dick's Sporting Goods annual report below. You can navigate through the pages in the report by either clicking on the pages listed below, or by using the keyword search tool below to find specific information within the annual report.-
 1
1 -
 2
2 -
 3
3 -
 4
4 -
 5
5 -
 6
6 -
 7
7 -
 8
8 -
 9
9 -
 10
10 -
 11
11 -
 12
12 -
 13
13 -
14
-
15
-
16
-
17
-
18
-
19
-
20
-
21
-
22
-
23
-
24
-
25
-
26
-
27
-
28
-
29
-
30
-
31
-
32
-
33
-
34
-
35
-
36
-
37
-
38
-
39
-
40
-
41
-
42
-
43
-
44
-
45
-
46
-
47
-
48
-
49
-
50
-
51
-
52
-
53
-
54
-
55
-
56
-
57
-
58
-
59
-
60
-
61
-
62
-
63
-
64
-
65
-
66
-
67
-
68
-
69
-
70
 |
 |

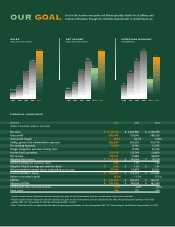
NET INCOME1
(DOLLARS IN MILLIONS)
2002 2003 2004 2005 2005P 2006
$112.6
$81.1
$94.5
$74.5
$50.3
$39.6
OPERATING MARGINS1
(PERCENTAGE)
2002 2003 2004 2005 2005P 2006
6.3
5.6
6.5
6.2
5.8
5.4
SALES
(DOLLARS IN MILLIONS)
2002 2003 2004 2005 2006
$3,114
$2,625
$2,109
$1,471
$1,273
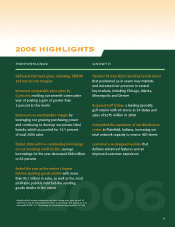
is to be the number one sports and fitness specialty retailer for all athletes and
outdoor enthusiasts, through the relentless improvement of everything we do.
OUR GOAL
FINANCIAL HIGHLIGHTS
Fiscal Year 2006 2005 2004
(Dollars in thousands, except per share data)
Net sales $ 3,114,162 $2,624,987 $2,109,399
Gross profit 896,699 737,640 586,526
Gross profit margin 28.8%28.1% 27.8%
Selling, general and administrative expenses 682,625 556,320 443,776
Pre-opening expenses 16,36410,781 11,545
Merger integration and store closing costs –37,790 20,336
Income from operations 197,710 132,749110,869
Net Income112,611 72,980 68,905
Adjusted Net Income2$ $112,611 $81,064$74,518
Diluted earnings per common share 2.03 1.35 1.30
Adjusted Diluted earnings per common share 2$ 2.03 $1.50 $1.41
Diluted weighted average shares outstanding (in thousands) 55,395 53,97952,921
Total stockholders’ equity$ 620,550 $414,793$313,667
Return on invested capital 10.5% 11.3% 12.1%
EBITDA $ 252,639 $184,454 $160,471
Adjusted EBITDA 2$ 252,639 $197,058 $165,799
Comparable store net sales increase 6.0% 2.6%2.6%
Store count 294255 234
1Results exclude merger integration and store closing costs, gain on sale of investment, and loss on write-down of non-cash investment.
2Results exclude merger integration and store closing costs, gain on sale of investment, and are adjusted for the effect of expensing stock options as if we had
applied SFAS 123, “Accounting for Stock-Based Compensation”, in 2005.
2005 P: Proforma results are adjusted for the effect of expensing stock options as if we had applied SFAS 123,
“
Accounting for Stock-Based Compensation”, in 2005.