Dell 2005 Annual Report Download - page 26
Download and view the complete annual report
Please find page 26 of the 2005 Dell annual report below. You can navigate through the pages in the report by either clicking on the pages listed below, or by using the keyword search tool below to find specific information within the annual report.-
 1
1 -
2
-
3
-
4
-
5
-
6
-
7
-
8
-
9
-
10
-
11
-
12
-
13
-
14
-
15
-
 16
16 -
 17
17 -
 18
18 -
 19
19 -
 20
20 -
 21
21 -
 22
22 -
 23
23 -
 24
24 -
 25
25 -
 26
26 -
 27
27 -
 28
28 -
 29
29 -
 30
30 -
 31
31 -
 32
32 -
 33
33 -
 34
34 -
 35
35 -
 36
36 -
37
-
38
-
39
-
40
-
41
-
42
-
43
-
44
-
45
-
46
-
47
-
48
-
49
-
50
-
51
-
52
-
53
-
54
-
55
-
56
-
57
-
58
-
59
-
60
-
61
-
62
-
63
-
64
-
65
-
66
-
67
-
68
-
69
-
70
-
71
-
72
-
73
-
74
-
75
-
76
-
77
-
78
-
79
-
80
 |
 |

Table of Contents
notebooks become more affordable, we continue to see a positive shift to mobility products in U.S. Consumer and our other segments.
We produced strong unit growth in our mobility products of 55% during fiscal 2006; however, this growth was partially offset by a 20%
decline in average revenue per-unit sold as product mix continued to shift toward lower-priced products.
• EMEA — EMEA revenue grew 19% on unit growth of 28% in fiscal 2006 compared to 27% revenue growth on 31% unit growth in fiscal 2005. Revenue
growth occurred primarily in the United Kingdom, France, and Germany in fiscal 2006, with Germany driving the region's growth. Year-over-year revenue
growth for the United Kingdom slowed to 12% for fiscal 2006 as compared to 32% for fiscal 2005, due to weaker performance in our relationship business,
which consists primarily of sales to corporate business accounts. All product categories in this region experienced growth for fiscal 2006 with mobility,
enhanced services and software and peripherals revenues posting strong gains.
• Asia Pacific-Japan — In fiscal 2006, year-over-year net revenue growth was 21% on unit growth of 30% in fiscal 2006 compared to 26% revenue growth
on 29% unit growth in fiscal 2005. The region's strong revenue growth in fiscal 2006 was led by growth in China. In fiscal 2006, South Korea, India,
Malaysia, and Singapore produced significant year-over-year growth at a higher rate than the overall region. All product categories in this region
experienced growth for fiscal 2006. Driving the growth were increases in enhanced services, software and peripherals, and mobility.
For additional information regarding our segments, see Note 9 of "Notes to Consolidated Financial Statements" included in "Item 8 — Financial
Statements and Supplementary Data."
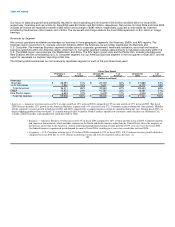
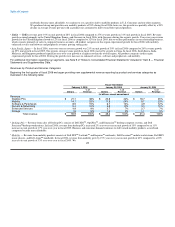
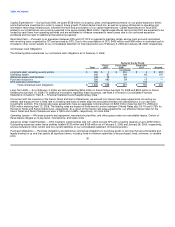
Revenues by Product and Services Categories
Beginning the first quarter of fiscal 2006 we began providing new supplemental revenue reporting by product and services categories as
illustrated in the following table:
Fiscal Year Ended
February 3, 2006 January 28, 2005 January 30, 2004
% of % of % of
Dollars Revenue Dollars Revenue Dollars Revenue
(in billions, except percentages)
Revenue:
Desktop PCs $ 21.1 38% $ 20.8 42% $ 18.7 45%
Mobility 14.1 25% 11.8 24% 9.7 23%
Software & Peripherals 8.5 15% 6.7 14% 4.9 12%
Servers & Networking 5.4 10% 4.9 10% 4.3 10%
Enhanced Services 4.9 9% 3.7 7% 2.7 7%
Storage 1.9 3% 1.3 3% 1.1 3%
Total revenue $ 55.9 100% $ 49.2 100% $ 41.4 100%
• Desktop PCs — Revenue from sales of Desktop PCs consists of Dell XPSTM, OptiPlexTM, and DimensionTM desktop computer systems, and Dell
PrecisionTMdesktop workstations. In fiscal 2006, revenue from desktop PCs increased 2% year-over-year on unit growth of 10% compared to an 11%
increase on unit growth of 17% year-over-year in fiscal 2005. Business and consumer demand continues to shift toward mobility products as notebook
computers become more affordable.
• Mobility — Revenue from mobility products consists of Dell XPSTM, LatitudeTM and InspironTM notebooks, Dell PrecisionTM mobile workstations, Dell MP3
music players, and Dell AximTM handhelds. In fiscal 2006, revenue from mobility grew by 19% year-over-year on unit growth of 43% compared to a 22%
increase on unit growth of 33% year-over-year in fiscal 2005. We 23