Dell 2005 Annual Report Download - page 25
Download and view the complete annual report
Please find page 25 of the 2005 Dell annual report below. You can navigate through the pages in the report by either clicking on the pages listed below, or by using the keyword search tool below to find specific information within the annual report.-
 1
1 -
2
-
3
-
4
-
5
-
6
-
7
-
8
-
9
-
10
-
11
-
12
-
13
-
14
-
 15
15 -
 16
16 -
 17
17 -
 18
18 -
 19
19 -
 20
20 -
 21
21 -
 22
22 -
 23
23 -
 24
24 -
 25
25 -
 26
26 -
 27
27 -
 28
28 -
 29
29 -
 30
30 -
 31
31 -
 32
32 -
 33
33 -
 34
34 -
 35
35 -
36
-
37
-
38
-
39
-
40
-
41
-
42
-
43
-
44
-
45
-
46
-
47
-
48
-
49
-
50
-
51
-
52
-
53
-
54
-
55
-
56
-
57
-
58
-
59
-
60
-
61
-
62
-
63
-
64
-
65
-
66
-
67
-
68
-
69
-
70
-
71
-
72
-
73
-
74
-
75
-
76
-
77
-
78
-
79
-
80
 |
 |

Table of Contents
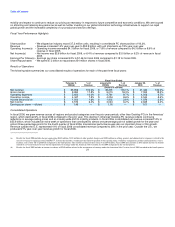
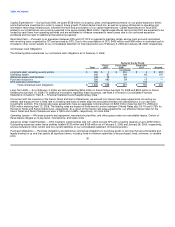
Our focus on balancing growth and profitability resulted in record operating and net income of $4.3 billion and $3.6 billion for fiscal 2006,
respectively. Operating and net income for fiscal 2005 were $4.3 billion and $3.0 billion, respectively. Net income for fiscal 2006 and fiscal 2005
includes an income tax repatriation benefit of $85 million and a charge of $280 million, respectively, pursuant to a favorable tax incentive
provided by the American Jobs Creation Act of 2004. The tax benefit and charge relate to the fiscal 2006 repatriation of $4.1 billion in foreign
earnings.
Revenues by Segment
We conduct operations worldwide and manage our business in three geographic segments: the Americas, EMEA, and APJ regions. The
Americas region covers the U.S., Canada, and Latin America. Within the Americas, we are further segmented into Business and
U.S. Consumer. The Americas Business segment includes sales to corporate, government, healthcare, education, and small and medium
business customers within the Americas region, while the U.S. Consumer segment includes sales primarily to individual consumers within the
U.S. The EMEA region covers Europe, the Middle East, and Africa. The APJ region covers Asia and the Pacific Rim, including Australia and
New Zealand. We are consolidating our U.S. Consumer segment into our Americas Business segment in the first quarter of fiscal 2007, and we
expect to reevaluate our segment reporting at that time.
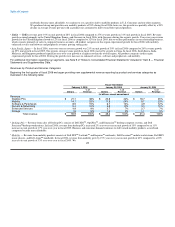
The following table summarizes our net revenue by reportable segment for each of the past three fiscal years:
Fiscal Year Ended
February 3, % of January 28, % of January 30, % of
2006 Revenue 2005 Revenue 2004 Revenue
(Dollars in millions)
Americas:
Business $ 28,481 51% $ 25,339 52% $ 21,888 53%
U.S. Consumer 7,930 14% 7,601 15% 6,715 16%
Total Americas 36,411 65% 32,940 67% 28,603 69%
EMEA 12,873 23% 10,787 22% 8,495 21%
Asia Pacific-Japan 6,624 12% 5,478 11% 4,346 10%
Total net revenue $ 55,908 100% $ 49,205 100% $ 41,444 100%
• Americas — Americas' revenues increased 11% on unit growth of 13% in fiscal 2006 compared to 15% on unit growth of 17% in fiscal 2005. The fiscal
2006 increase includes 12% growth in our Americas Business segment and a 4% increase in our U.S. Consumer segment during the same periods. Mobility
led the segment's revenue growth in both fiscal 2006 and 2005, supported by an improvement in corporate spending during the year. During fiscal 2006, we
began shipping products from our third U.S. manufacturing facility located in North Carolina, opened new customer contact facilities in Oklahoma City,
Canada, and El Salvador, and expanded our small parts hub in Ohio.
• Business — Americas Business revenue increased 12% in fiscal 2006 compared to 16% revenue growth in fiscal 2005. Corporate growth
and Americas International, which includes countries in the North and South America other than the United States, drove the majority of
the increase in revenue in the Americas. Americas International produced strong revenue growth of 30% year-over-year for fiscal 2006.
Our federal business experienced weak demand for most of fiscal 2006, resulting in a year-over-year decline in fiscal 2006.
• Consumer — U.S. Consumer revenue grew 4% in fiscal 2006 compared to 13% in fiscal 2005. U.S. Consumer revenue growth slowed as
compared to fiscal 2005 due to a 14% decline in desktop revenue and overall competitive price pressure. As
22