Dell 2001 Annual Report Download - page 57
Download and view the complete annual report
Please find page 57 of the 2001 Dell annual report below. You can navigate through the pages in the report by either clicking on the pages listed below, or by using the keyword search tool below to find specific information within the annual report.-
 1
1 -
2
-
3
-
4
-
5
-
6
-
7
-
8
-
9
-
10
-
11
-
12
-
13
-
14
-
15
-
16
-
17
-
18
-
19
-
20
-
21
-
22
-
23
-
24
-
25
-
26
-
27
-
28
-
29
-
30
-
31
-
32
-
33
-
34
-
35
-
36
-
37
-
38
-
39
-
40
-
41
-
42
-
43
-
44
-
45
-
46
-
 47
47 -
 48
48 -
 49
49 -
 50
50 -
 51
51 -
 52
52 -
 53
53 -
 54
54 -
 55
55 -
 56
56 -
 57
57 -
 58
58 -
 59
59 -
 60
60 -
 61
61 -
 62
62 -
 63
63 -
 64
64 -
 65
65 -
 66
66 -
 67
67 -
68
-
69
-
70
-
71
-
72
-
73
-
74
-
75
 |
 |

Table of Contents
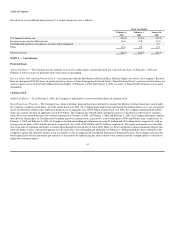
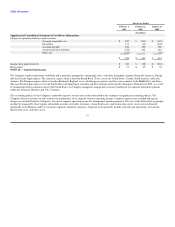
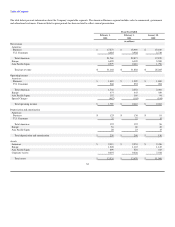
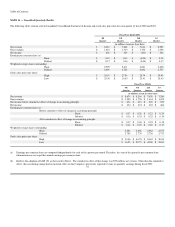
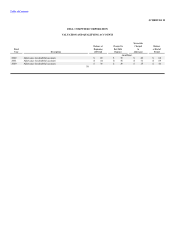
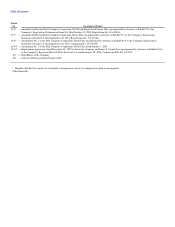
NOTE 11 — Unaudited Quarterly Results
The following tables contain selected unaudited Consolidated Statement of Income and stock sales price data for each quarter of fiscal 2002 and 2001.
Fiscal Year Ended 2002
4th 3rd 2nd 1st
Quarter Quarter Quarter Quarter
(in millions, except per share data)
Net revenue $ 8,061 $ 7,468 $ 7,611 $ 8,028
Gross margin $ 1,416 $ 1,313 $ 1,330 $ 1,448
Net income $ 456 $ 429 $ (101) $ 462
Earnings per common share (a):
Basic $ 0.18 $ 0.16 $ (0.04) $ 0.18
Diluted $ 0.17 $ 0.16 $ (0.04) $ 0.17
Weighted average shares outstanding:
Basic 2,599 2,611 2,601 2,600
Diluted 2,690 2,728 2,601 2,757
Stock sales prices per share:
High $ 29.67 $ 27.84 $ 28.74 $ 30.49
Low $ 25.30 $ 16.63 $ 23.41 $ 20.63
Fiscal Year 2001(b)
4th 3rd 2nd 1st
Quarter Quarter Quarter Quarter
(in millions, except per share data)
Net revenue $ 8,674 $ 8,264 $ 7,670 $ 7,280
Gross margin $ 1,559 $ 1,758 $ 1,634 $ 1,492
Net income before cumulative effect of change in accounting principle $ 434 $ 674 $ 603 $ 525
Net income $ 434 $ 674 $ 603 $ 466
Earnings per common share (a):
Before cumulative effect of change in accounting principle
Basic $ 0.17 $ 0.26 $ 0.23 $ 0.20
Diluted $ 0.16 $ 0.25 $ 0.22 $ 0.19
After cumulative effect of change in accounting principle
Basic $ 0.17 $ 0.26 $ 0.23 $ 0.18
Diluted $ 0.16 $ 0.25 $ 0.22 $ 0.17
Weighted average shares outstanding:
Basic 2,582 2,586 2,582 2,575
Diluted 2,783 2,739 2,726 2,737
Stock sales prices per share:
High $ 33.06 $ 44.25 $ 54.67 $ 59.69
Low $ 16.25 $ 22.75 $ 42.00 $ 35.00
(a) Earnings per common share are computed independently for each of the quarters presented. Therefore, the sum of the quarterly per common share
information may not equal the annual earnings per common share.
(b) Reflects the adoption of SAB 101 as discussed in Note 1. The cumulative effect of this change was $59 million, net of taxes. Other than the cumulative
effect, this accounting change had no material effect on the Company's previously reported revenue or quarterly earnings during fiscal 2001.
54