DSW 2008 Annual Report Download - page 2
Download and view the complete annual report
Please find page 2 of the 2008 DSW annual report below. You can navigate through the pages in the report by either clicking on the pages listed below, or by using the keyword search tool below to find specific information within the annual report.-
 1
1 -
 2
2 -
 3
3 -
 4
4 -
 5
5 -
 6
6 -
 7
7 -
 8
8 -
 9
9 -
 10
10 -
 11
11 -
 12
12 -
 13
13 -
14
-
15
-
16
-
17
-
18
-
19
-
20
-
21
-
22
-
23
-
24
-
25
-
26
-
27
-
28
-
29
-
30
-
31
-
32
-
33
-
34
-
35
-
36
-
37
-
38
-
39
-
40
-
41
-
42
-
43
-
44
-
45
-
46
-
47
-
48
-
49
-
50
-
51
-
52
-
53
-
54
-
55
-
56
-
57
-
58
-
59
-
60
-
61
-
62
-
63
-
64
-
65
-
66
-
67
-
68
-
69
-
70
-
71
-
72
-
73
-
74
-
75
-
76
-
77
-
78
-
79
-
80
-
81
-
82
-
83
-
84
 |
 |
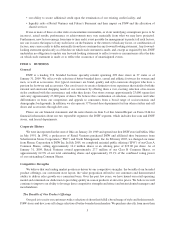
FINANCIAL highlights
(
D
o
l
l
a
r
s
i
n
t
h
o
u
s
a
n
d
s
e
x
c
e
p
t
n
e
t
s
a
l
e
s
p
e
r
a
v
e
r
a
g
e
g
r
o
s
s
s
q
u
a
r
e
f
o
o
t
)
For the Fiscal Year Ende
d
1
/31/0
9
2
/2/08 2/3/0
7
ST
A
T
E
M
E
N
T OF
I
N
C
OM
E
D
A
T
A
(
1
)
N
et sales
(
2) 1,
4
62,9
44
1
,
4
05,615 1,
2
7
9
,
060
G
ross profi
t
379
,
099 370
,
135
3
66
,
351
O
perating profit 42
,
813
8
1
,32
1100
,
714
N
et income
26
,
902
53
,775 65,
4
6
4
Diluted earnings per share
0.61
1
.
21 1
.48
B
A
L
A
N
C
E
SHEET DA
T
A
Tota
l
assets
72
1,1
9
7
693
,
882
608
,
303
Working ca
p
ital
(
3
)
295
,
721
2
82
,
717
2
98
,
704
O
THER D
A
T
A
Number of DSW stores:
Beginning o
f
p
eriod
2
5
9
223
1
99
N
e
w
stores
4
1
3
7 2
9
C
l
ose
d/
re-cate
g
orize
d
stores
(
2
)
(
1 ) ( 5
)
End o
f
p
eriod
298
2
5
9
223
Com
p
arable DSW stores (units) (4
)
2
1
7
1
92
1
63
DSW total square footage
(
5
)
6,
749
,
690 6
,
142
,
685 5
,
534
,
243
Average gross s
q
uare
f
ootage
(
6
)
6
,4
5
4,
396
5,
81
4,
398 5
,
271
,
7
4
8
Net sales per average gross sq. ft. (7
)
1
96
212
2
1
8
N
umber of leased shoe departments
at end of period 37
7
378 360
T
otal comparable store sales change
(4)
(
5.9%
)
(0.8%)
2
.5
%
(
1
)
A
ll fiscal
y
ears are based on a 52-week
y
ear
.
(
2
)
I
ncludes net sales of leased de
p
artments.
(
3
)
W
orking ca
p
ital re
p
resents current assets less current liabilities.
(4)
Com
p
arable DSW stores and com
p
arable leased de
p
artments are those units that have been in o
p
eration for at least 14 months at the beginning of the fiscal
y
ear. Stores or leased
d
epartments, as the case may be, are added to the comparable base at the beginning o
f
the year and are dropped
f
or comparative purposes in the quarter that they are closed
.
(5
)
D
SW total square
f
ootage represents the total amount o
f
square
f
ootage
f
or DSW stores only; it does not re
f
lect square
f
ootage o
f
leased departments
.
(6
)
Average gross square
f
ootage represents the monthly average o
f
square
f
eet
f
or DSW stores only
f
or each period presented and consequently re
f
lects the e
ff
ect o
f
opening stores
i
n different months throughout the
p
eriod.
(
7
)
Net sales
p
er average gross s
q
uare foot is the result of dividing net sales for DSW stores onl
y
for the
p
eriod
p
resented, b
y
average gross s
q
uare footage calculated as described
i
n note 6 a
b
o
v
e.
$
$
$
$
$
$
$
$
$
$
$
$
$
$
$
$
$
$
$
$
$
per share and
$$$