Creative 2002 Annual Report Download - page 6
Download and view the complete annual report
Please find page 6 of the 2002 Creative annual report below. You can navigate through the pages in the report by either clicking on the pages listed below, or by using the keyword search tool below to find specific information within the annual report.-
 1
1 -
 2
2 -
 3
3 -
 4
4 -
 5
5 -
 6
6 -
 7
7 -
 8
8 -
 9
9 -
 10
10 -
 11
11 -
 12
12 -
 13
13 -
 14
14 -
 15
15 -
 16
16 -
 17
17 -
18
-
19
-
20
-
21
-
22
-
23
-
24
-
25
-
26
-
27
-
28
-
29
-
30
-
31
-
32
-
33
-
34
-
35
-
36
-
37
-
38
-
39
-
40
-
41
-
42
-
43
-
44
-
45
-
46
-
47
-
48
-
49
-
50
-
51
-
52
-
53
-
54
-
55
-
56
 |
 |

4
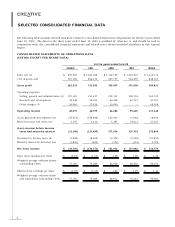
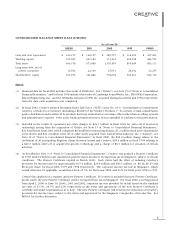
The following table contains selected data from Creative’s Consolidated Statements of Operations for the five years ended
June 30, 2002. The data for the three years ended June 30, 2002 is qualified by reference to, and should be read in
conjunction with, the consolidated financial statements and related notes thereto included elsewhere in this Annual
Report.
CONSOLIDATED STATEMENTS OF OPERATIONS DATA
(US$’000, EXCEPT PER SHARE DATA):
For the years ended June 30
2002(1) 2001 2000 1999 1998(1)
Sales, net (2) $ 805,905 $ 1,226,068 $ 1,342,192 $ 1,296,403 $ 1,234,136
Cost of goods sold 543,382 894,236 947,157 944,499 848,305
Gross profit 262,523 331,832 395,035 351,904 385,831
Operating expenses:
Selling, general and administrative (2) 170,122 230,417 252,321 209,534 162,392
Research and development 38,248 54,022 60,428 46,725 41,723
Other charges (3) 26,080 22,814 20,000 – 68,568
Operating income 28,073 24,579 62,286 95,645 113,148
(Loss) gain from investments, net (45,414) (148,490) 103,443 15,048 18,469
Interest income and other, net 5,155 2,416 5,287 14,621 21,183
(Loss) income before income
taxes and minority interest (12,186) (121,495) 171,016 125,314 152,800
Provision for income taxes (4) (5,698) (8,409) (9,472) (9,920) (19,805)
Minority interest in (income) loss (1,843) (469) (532) (312) 1,779
Net (loss) income $ (19,727) $ (130,373) $ 161,012 $ 115,082 $ 134,774
Basic (loss) earnings per share $ (0.27) $ (1.65) $ 1.96 $ 1.28 $ 1.49
Weighted average ordinary shares
outstanding (’000) 73,182 79,049 82,028 89,818 90,654
Diluted (loss) earnings per share $ (0.27) $ (1.65) $ 1.86 $ 1.25 $ 1.42
Weighted average ordinary shares
and equivalents outstanding (’000) 73,182 79,049 86,612 92,241 94,964
SELECTED CONSOLIDATED FINANCIAL DATA