Cracker Barrel 2009 Annual Report Download - page 7
Download and view the complete annual report
Please find page 7 of the 2009 Cracker Barrel annual report below. You can navigate through the pages in the report by either clicking on the pages listed below, or by using the keyword search tool below to find specific information within the annual report.-
 1
1 -
 2
2 -
 3
3 -
 4
4 -
 5
5 -
 6
6 -
 7
7 -
 8
8 -
 9
9 -
 10
10 -
 11
11 -
 12
12 -
 13
13 -
 14
14 -
 15
15 -
 16
16 -
 17
17 -
 18
18 -
19
-
20
-
21
-
22
-
23
-
24
-
25
-
26
-
27
-
28
-
29
-
30
-
31
-
32
-
33
-
34
-
35
-
36
-
37
-
38
-
39
-
40
-
41
-
42
-
43
-
44
-
45
-
46
-
47
-
48
-
49
-
50
-
51
-
52
-
53
-
54
-
55
-
56
-
57
-
58
-
59
-
60
-
61
-
62
-
63
-
64
-
65
-
66
-
67
-
68
-
69
-
70
-
71
-
72
-
73
-
74
-
75
-
76
-
77
-
78
-
79
-
80
-
81
-
82
 |
 |

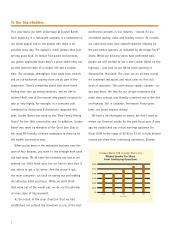
5
the headwinds that we encountered all year long, we
reported 2009 EPS of $2.89, up 3.6 percent from fiscal
2008 and along the way we were able to beat analyst
expectations in each of the four quarters. Revenue from
continuing operations declined 0.7 percent to $2.37
billion. Comparable store restaurant sales decreased 1.7
percent (including the effect of a 2.9 percent higher
check) from fiscal 2008, and comparable store retail sales
were down 5.9 percent. Declining traffic caused operating
income to decline 5.7 percent. During the year, we opened
11 new Cracker Barrel Old Country Store®locations.
Commodity costs were up only 2.3 percent in 2009.
In the retail business, we made heavy use of markdowns
to reduce inventory. While we were more productive with
labor hours, our costs did increase from the new health
plan that we implemented at mid-year for our restaurant
employees. Our “outlier” program, which focuses generally
on our 50 bottom stores in order to improve performance,
was used to control operating expenses as a percent of
sales compared with the previous year.
I also am happy to report that despite pressure on
profits, we continue to generate strong cash flow.
Net cash from operating activities was $164 million,
which more than funded $68 million of capital
expenditures. During 2009, we paid aggregate dividends
of $0.78 per share. We combined the proceeds from
the sale/leaseback of 15 store locations and our retail
distribution center with excess cash flow to pay
down $143 million of debt. In fiscal 2010, we intend to
opportunistically explore refinancing options for our
outstanding debt.
DELIVERING THE CRACKER BARREL EXPERIENCE
When times get tough, the competition gets tougher.
You can see this by looking at the price wars being
waged by our competitors every day. We know that price
is important. In fact, it has become the main weapon
in a crowded field of dining options that are all too similar
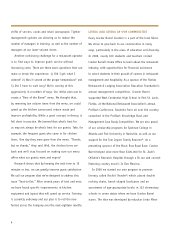
Net Cash Provided by Operating Activities
Cash Used to Purchase Property and Equipment
Fiscal Year
Cracker Barrel Old Country Store,Inc.
Ca lo ro Oerat on and
Ca tal end ture
n ll on
Cracker Barrel Old Country Store,Inc.
dend Outlay
and dend er Sare
$25
$15
$10
$5
$0
dend on Co on Stock n ll on
2002005 200 200 200
$20
dend er S are
$1 00
$0 0
$0 0
$0 0
$0 20
$0 00
Dividends Paid on Common Stock
Dividends Per Share
6948Narrative.qxd:Layout 1 10/6/09 2:37 PM Page 6