Comfort Inn 2009 Annual Report Download - page 3
Download and view the complete annual report
Please find page 3 of the 2009 Comfort Inn annual report below. You can navigate through the pages in the report by either clicking on the pages listed below, or by using the keyword search tool below to find specific information within the annual report.-
 1
1 -
 2
2 -
 3
3 -
 4
4 -
 5
5 -
 6
6 -
 7
7 -
 8
8 -
 9
9 -
 10
10 -
 11
11 -
 12
12 -
 13
13 -
 14
14 -
15
-
16
 |
 |

2009 Annual Review | 3
Annual Review
net income
(millions)
$111.3
$112.8
$87.6
$98.3
$100.2
09080706
$1.69
$1.67
$1.31
diluted earnings
per share
$1.63
09
$1.59
080706
hotels under
development
worldwide*
1,093
930
687
843
09
1,108
080706
$615.5
$641.7
$564.2
$539.9
$472.1
05 08 090706
revenues
(millions)
6,021
090706
hotels open
worldwide
5,827
08
5,570
5,376
5,210
05 05 05 05
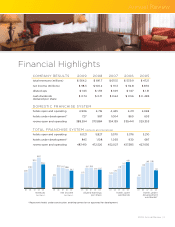
COMPANY RESULTS 2009 2008 2007 2006 2005
total revenues (millions) $ 564.2 $ 641.7 $ 615.5 $ 539.9 $ 472.1
net income (millions) $ 98.3 $ 100.2 $ 111.3 $ 112.8 $ 87.6
diluted eps $ 1.63 $ 1.59 $ 1.69 $ 1.67 $ 1.31
cash dividends
declared per share
$ 0.74 $ 0.71 $ 0.64 $ 0.56 $ 0. 485
DOMESTIC FRANCHISE SYSTEM
hotels open and operating 4,906 4,716 4,445 4,211 4,048
hotels under development* 727 987 1,004 860 603
rooms open and operating 388,594 373,884 354,139 339,441 329,353
TOTAL FRANCHISE SYSTEM (domestic and international)
hotels open and operating 6,021 5,827 5,570 5,376 5,210
hotels under development* 843 1,108 1,093 930 687
rooms open and operating 487,410 472,526 452,027 437,385 427,056
* Represents hotels under construction, awaiting conversion or approved for development.
Financial Highlights