ComEd 2011 Annual Report Download - page 32
Download and view the complete annual report
Please find page 32 of the 2011 ComEd annual report below. You can navigate through the pages in the report by either clicking on the pages listed below, or by using the keyword search tool below to find specific information within the annual report.-
 1
1 -
2
-
3
-
4
-
5
-
6
-
7
-
8
-
9
-
10
-
11
-
12
-
13
-
14
-
15
-
16
-
17
-
18
-
19
-
20
-
21
-
 22
22 -
 23
23 -
 24
24 -
 25
25 -
 26
26 -
 27
27 -
 28
28 -
 29
29 -
 30
30 -
 31
31 -
 32
32 -
 33
33 -
 34
34 -
 35
35 -
 36
36 -
 37
37 -
 38
38 -
 39
39 -
 40
40 -
 41
41 -
 42
42 -
43
-
44
-
45
-
46
 |
 |

30
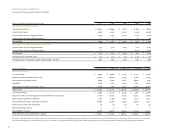
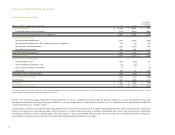
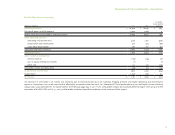
Discussion of Financial Results - by Business Segment
Results of Operations by Business Segment
The comparisons of 2011 and 2010 operating results and other statistical information set forth below include intercompany transactions, which are eliminated in
Exelon’s consolidated financial statements.
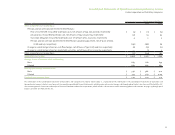
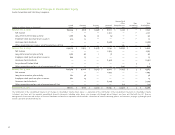
Net Income (Loss) by Business Segment
(Dollars in millions) 2011 2010
Favorable
(Unfavorable)
Variance
Generation $ 1,771 $ 1,972 $ (201)
ComEd 416 337 79
PECO 389 324 65
Other (a) (81) (70) (11)
Total $ 2,495 $ 2,563 $ (68)
(a) Other primarily includes corporate operations, BSC and intersegment eliminations.