ComEd 2011 Annual Report Download - page 30
Download and view the complete annual report
Please find page 30 of the 2011 ComEd annual report below. You can navigate through the pages in the report by either clicking on the pages listed below, or by using the keyword search tool below to find specific information within the annual report.-
 1
1 -
2
-
3
-
4
-
5
-
6
-
7
-
8
-
9
-
10
-
11
-
12
-
13
-
14
-
15
-
16
-
17
-
18
-
19
-
 20
20 -
 21
21 -
 22
22 -
 23
23 -
 24
24 -
 25
25 -
 26
26 -
 27
27 -
 28
28 -
 29
29 -
 30
30 -
 31
31 -
 32
32 -
 33
33 -
 34
34 -
 35
35 -
 36
36 -
 37
37 -
 38
38 -
 39
39 -
 40
40 -
41
-
42
-
43
-
44
-
45
-
46
 |
 |

28
Discussion of Financial Results - Exelon
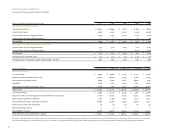
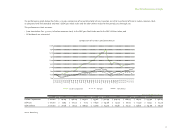
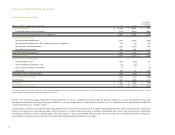
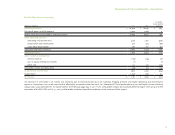
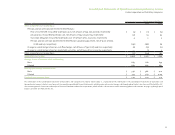
Results of Operations—Exelon
(Dollars in millions, except for per share data) 2011 2010
Favorable
(Unfavorable)
Variance
Operating revenues $ 18,924 $ 18,644 $ 280
Purchased power and fuel expense 7,128 6,435 (693)
Revenue net of purchased power and fuel expense 11,796 12,209 (413)
Other operating expenses
Operating and maintenance 5,012 4,453 (559)
Operating and maintenance for regulatory required programs (a) 184 147 (37)
Depreciation and amortization 1,335 2,075 740
Taxes other than income 785 808 23
Total other operating expenses 7,316 7,483 167
Operating income 4,480 4,726 (246)
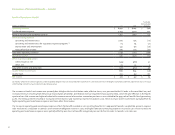
Other income and deductions
Interest expense, net (701) (792) 91
Interest expense to affiliates, net (25) (25) —
Loss in equity method investments (1) — (1)
Other, net 199 312 (113)
Total other income and deductions (528) (505) (23)
Income before income taxes 3,952 4,221 (269)
Income taxes 1,457 1,658 201
Net income $ 2,495 $ 2,563 $ (68)
Diluted earnings per share $ 3.75 $ 3.87 $ (0.12)
(a) Includes amounts for various legislative and/or regulatory programs that are recoverable from customers on a full and current basis through a reconcilable automatic adjustment clause. An equal
and offsetting amount has been reflected in operating revenues.
Exelon’s net income was $2,495 million for the year ended Dec. 31, 2011, as compared to $2,563 million for the year ended Dec. 31, 2010, and diluted earnings per
average common share were $3.75 for the year ended Dec. 31, 2011, as compared to $3.87 for the year ended Dec. 31, 2010. All amounts presented below are before the
impact of income taxes, except as noted.
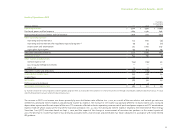
Exelon and its subsidiaries evaluate their operating performance using the measure of revenue net of purchased power and fuel expense. Exelon and its subsidiaries
believe that revenue net of purchased power and fuel expense is a useful measure because it provides information that can be used to evaluate its operational
performance. Revenue net of purchased power and fuel expense is not a presentation defined under GAAP and may not be comparable to other companies’
presentations or deemed more useful than the GAAP information provided elsewhere in this report.