ComEd 2008 Annual Report Download - page 34
Download and view the complete annual report
Please find page 34 of the 2008 ComEd annual report below. You can navigate through the pages in the report by either clicking on the pages listed below, or by using the keyword search tool below to find specific information within the annual report.-
 1
1 -
2
-
3
-
4
-
5
-
6
-
7
-
8
-
9
-
10
-
11
-
12
-
13
-
14
-
15
-
16
-
17
-
18
-
19
-
20
-
21
-
22
-
23
-
 24
24 -
 25
25 -
 26
26 -
 27
27 -
 28
28 -
 29
29 -
 30
30 -
 31
31 -
 32
32 -
 33
33 -
 34
34 -
 35
35 -
 36
36 -
 37
37 -
 38
38 -
 39
39 -
 40
40 -
 41
41 -
 42
42 -
 43
43 -
 44
44 -
45
-
46
 |
 |

DiscussionofFinancialResults-ComEd
32
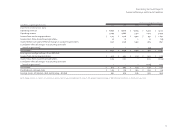
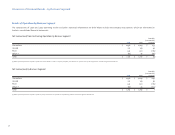
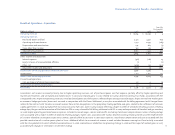
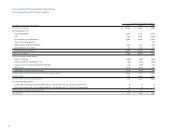
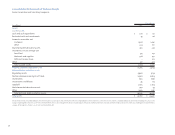
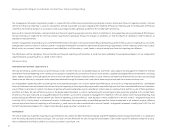
ResultsofOperations–ComEd
Favorable
(Unfavorable)
(Dollarsinmillions) 2008 2007 Variance
Operatingrevenues $ 6,136 $ 6,104 $ 32
Purchasedpowerexpense 3,582 3,747 165
Revenuenetofpurchasedpowerexpense 2,554 2,357 197
Otheroperatingexpenses
Operatingandmaintenance 1,125 1,091 (34)
Depreciationandamortization 464 440 (24)
Taxesotherthanincome 298 314 16
Totalotheroperatingexpenses 1,887 1,845 (42)
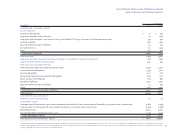
Operatingincome 667 512 155
Otherincomeanddeductions
Interestexpense,net (348) (318) (30)
Equityinlossesofunconsolidatedafliates (8) (7) (1)
Other,net 18 58 (40)
Totalotherincomeanddeductions (338) (267) (71)
Incomebeforeincometaxes 329 245 84
Incometaxes 128 80 (48)
Netincome(loss) $ 201 $ 165 $ 36
ComEd’s net income for 2008 compared to 2007 reected higher revenue net of purchased power expense, primarily driven by higher transmission rates effective
May 1, 2007 and June 1, 2008 and higher distribution rates effective September 16, 2008. In 2008, ComEd received a refund of Illinois Distribution Tax that also
contributedtotheincreaseinnetincome.Theseincreaseswerepartiallyoffsetbyunfavorableweather;higheroperatingandmaintenanceexpense,principallydriven
bydisallowancesarisingfromthe2007RateCaseorder,higherstormcostsandanincreaseintheallowanceforuncollectibleaccountsexpense;higherdepreciationand
amortizationexpense;andhigherinterestexpense.