Cogeco 2004 Annual Report Download - page 3
Download and view the complete annual report
Please find page 3 of the 2004 Cogeco annual report below. You can navigate through the pages in the report by either clicking on the pages listed below, or by using the keyword search tool below to find specific information within the annual report.-
 1
1 -
 2
2 -
 3
3 -
 4
4 -
 5
5 -
 6
6 -
 7
7 -
 8
8 -
 9
9 -
 10
10 -
 11
11 -
 12
12 -
 13
13 -
 14
14 -
15
-
16
-
17
-
18
-
19
-
20
-
21
-
22
-
23
-
24
-
25
-
26
-
27
-
28
-
29
-
30
-
31
-
32
-
33
-
34
-
35
-
36
-
37
-
38
-
39
-
40
-
41
-
42
-
43
-
44
-
45
-
46
-
47
-
48
-
49
-
50
-
51
-
52
-
53
-
54
-
55
-
56
-
57
-
58
-
59
-
60
 |
 |

Cogeco Cable Inc. 2004 1
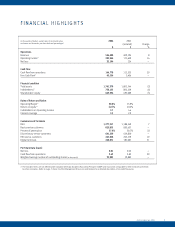
(in thousands of dollars, except rates of return and ratios, 2004 2003
customers and terminals, per share data and percentages) (restated) Change
$$%
Operations
Revenue 526,480 489,194 8
Operating Income
(1)
203,246 175,609 16
Net loss 32,194 124 —
Cash Flow
Cash flow from operations 144,778 112,525 29
Free Cash Flow
(1)
43,534 2,406 —
Financial condition
Total assets 1,761,379 1,802,744 (2)
Indebtedness
(1)
758,133 806,429 (6)
Shareholders’ equity 663,534 695,089 (5)
Rates of Return and Ratios
Operating Margin
(1)
38.6% 35.9%
Return on equity
(1)
(4.7)% (0.0)%
Indebtedness on Operating Income 3.7 4.6
Interest coverage 3.5 2.9
Customers and Terminals
RGU 1,277,317 1,188,369 7
Basic-service customers 823,855 820,657 —
Percent of penetration 57.9% 58.7% (1)
Discretionary service customers 641,239 639,820 —
HSI service customers 245,026 205,179 19
Digital terminals 240,071 183,087 31
Per Share Data (basic)
Net loss 0.81 0.00 —
Cash flow from operations 3.63 2.82 29
Weighted average number of outstanding shares (in thousands) 39,902 39,882 —
(1)
The indicated terms are not defined under Canadian Generally Accepted Accounting Principles (GAAP) and may not be comparable to other measures presented
by other companies. Refer to pages 7, 8 and 15 of the Management Discussion and Analysis for a detailed description of non-GAAP measures.
FINANCIAL HIGHLIGHTS