Cogeco 2004 Annual Report Download - page 13
Download and view the complete annual report
Please find page 13 of the 2004 Cogeco annual report below. You can navigate through the pages in the report by either clicking on the pages listed below, or by using the keyword search tool below to find specific information within the annual report.-
 1
1 -
2
-
 3
3 -
 4
4 -
 5
5 -
 6
6 -
 7
7 -
 8
8 -
 9
9 -
 10
10 -
 11
11 -
 12
12 -
 13
13 -
 14
14 -
 15
15 -
 16
16 -
 17
17 -
 18
18 -
 19
19 -
 20
20 -
 21
21 -
 22
22 -
 23
23 -
24
-
25
-
26
-
27
-
28
-
29
-
30
-
31
-
32
-
33
-
34
-
35
-
36
-
37
-
38
-
39
-
40
-
41
-
42
-
43
-
44
-
45
-
46
-
47
-
48
-
49
-
50
-
51
-
52
-
53
-
54
-
55
-
56
-
57
-
58
-
59
-
60
 |
 |

MANAGEMENT’S DISCUSSION AND ANALYSIS
Cogeco Cable Inc. 2004 11
•
The costs to reconnect customers are now recorded as deferred
charges up to a maximum amount not exceeding the revenue
generated by the reconnect activity, which are included in
installation revenues, and amortized over the average life of
acustomer, which is four years. Previously, these costs, which
include materials, direct labour and certain overhead charges
were capitalized to fixed assets and generally amortized over
aperiod of five years.
•
Revenue from the sale of home terminal devices at a subsidized
price, which were recorded as a partial recovery of costs, are
now recorded as equipment revenue with an equal amount
included in operating costs.
•
The portion of advertising expense incurred to expand the
digital and HSI customer base that used to be recorded as a
deferred charge is now recorded as an operating cost.
As a result of the above changes, Operating Income was adjusted
downward by $8 million and $7.7 million in fiscal 2004 and 2003,
respectively. The adjustments related to the reversal of capital-
ized advertising expense and reconnection costs amounted to
$3.7 million and $1.2 million in fiscal 2004 and $3.5 million and
$2.7 million in fiscal 2003. Cogeco Cable has decided to apply
these changes retroactively to enhance the comparability of its
financial disclosure. The changes, relating to revenue recognition,
had the following impact on our financial results and cash flow for
fiscal 2004 and 2003 and financial position as at August 31, 2004
and 2003:
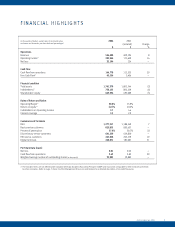
Years ended August 31, 2004 2003
Before After Before After
(in thousands of dollars, except per share data and percentages) adoption adoption restatement restatement
$$$$
Revenue 519,753 526,480 479,293 489,194
Operating Income 211,224 203,246 183,344 175,609
Operating Margin 40.6% 38.6% 38.3% 35.9%
Amortization 136,072 140,214 107,158 110,234
Income taxes 43,831 37,269 7,194 4,386
Net income (loss) (26,636) (32,194) 7,879 (124)
Basic net income (loss) per share (0.67) (0.81) 0.20 (0.00)
Capital expenditures and increase in deferred charges 106,893 101,244 117,009 110,119
Free Cash Flow 45,863 43,534 3,251 2,406
As at August 31, 2004 2003
Before After Before After
(in thousands of dollars) adoption adoption restatement restatement
$$$$
Fixed assets 739,547 687,960 765,085 723,273
Deferred charges 34,273 48,293 39,147 53,186
Deferred and prepaid income 16,070 32,437 15,194 29,232
Future income tax liabilities 214,296 195,523 172,588 160,380
Retained earnings 69,041 33,880 95,677 66,074