Cisco 2009 Annual Report Download - page 78
Download and view the complete annual report
Please find page 78 of the 2009 Cisco annual report below. You can navigate through the pages in the report by either clicking on the pages listed below, or by using the keyword search tool below to find specific information within the annual report.-
 1
1 -
2
-
3
-
4
-
5
-
6
-
7
-
8
-
9
-
10
-
11
-
12
-
13
-
14
-
15
-
16
-
17
-
18
-
19
-
20
-
21
-
22
-
23
-
24
-
25
-
26
-
27
-
28
-
29
-
30
-
31
-
32
-
33
-
34
-
35
-
36
-
37
-
38
-
39
-
40
-
41
-
42
-
43
-
44
-
45
-
46
-
47
-
48
-
49
-
50
-
51
-
52
-
53
-
54
-
55
-
56
-
57
-
58
-
59
-
60
-
61
-
62
-
63
-
64
-
65
-
66
-
67
-
 68
68 -
 69
69 -
 70
70 -
 71
71 -
 72
72 -
 73
73 -
 74
74 -
 75
75 -
 76
76 -
 77
77 -
 78
78 -
 79
79 -
 80
80 -
 81
81 -
 82
82 -
 83
83 -
 84
84
 |
 |

Notes to Consolidated Financial Statements
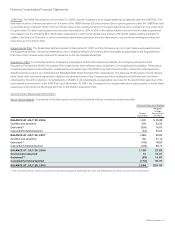
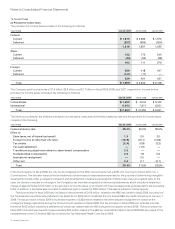
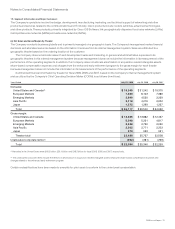
(b) Net Sales for Groups of Similar Products and Services
The following table presents net sales for groups of similar products and services (in millions):
Years Ended July 25, 2009 July 26, 2008 July 28, 2007
Net sales:
Routers $ 6,271 $ 7,895 $ 7,064
Switches 12,025 13,457 12,432
Advanced technologies 9,218 9,559 7,926
Other 1,617 2,188 2,040
Product 29,131 33,099 29,462
Service 6,986 6,441 5,460
Total $ 36,117 $ 39,540 $ 34,922
Certain reclassifications have been made to amounts for prior years to conform to the current year’s presentation.
The Company refers to some of its products and technologies as advanced technologies. As of July 25, 2009, the Company had
identified the following advanced technologies for particular focus: application networking services, home networking, security, storage
area networking, unified communications, video systems, and wireless technology. The Company continues to identify additional advanced
technologies for focus and investment in the future, and the Company’s investments in some previously-identified advanced technologies
may be curtailed or eliminated depending on market developments.
(c) Other Segment Information
The majority of the Company’s assets, excluding cash and cash equivalents and investments, as of July 25, 2009 and July 26, 2008 were
attributable to its U.S. operations. The Company’s total cash and cash equivalents and investments held outside of the United States in
various foreign subsidiaries was $29.1 billion and $24.4 billion as of July 25, 2009 and July 26, 2008, respectively, and the remaining $5.9
billion and $1.8 billion at the respective year ends was held in the United States. In fiscal 2009, 2008, and 2007, no single customer
accounted for 10% or more of the Company’s net sales.
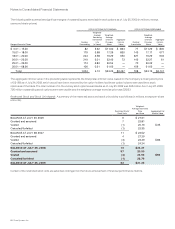
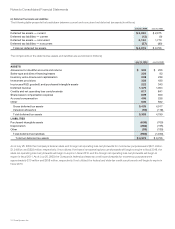
Property and equipment information is based on the physical location of the assets. The following table presents property and
equipment information for geographic areas (in millions):
July 25, 2009 July 26, 2008 July 28, 2007
Property and equipment, net:
United States $3,330 $3,478 $3,340
International 713 673 553
Total $4,043 $4,151 $3,893
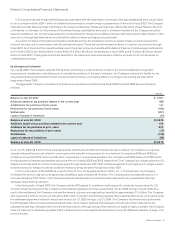
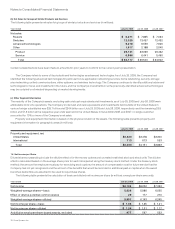
16. Net Income per Share
Diluted shares outstanding include the dilutive effect of in-the-money options and unvested restricted stock and stock units. The dilutive
effect is calculated based on the average share price for each fiscal period using the treasury stock method. Under the treasury stock
method, the amount the employee must pay for exercising stock options, the amount of compensation cost for future service that the
Company has not yet recognized, and the amount of tax benefits that would be recorded in additional paid-in capital when the award
becomes deductible are assumed to be used to repurchase shares.
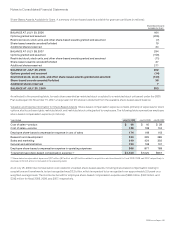
The following table presents the calculation of basic and diluted net income per share (in millions, except per-share amounts):
Years Ended July 25, 2009 July 26, 2008 July 28, 2007
Net income $6,134 $8,052 $7,333
Weighted-average shares—basic 5,828 5,986 6,055
Effect of dilutive potential common shares 29 177 210
Weighted-average shares—diluted 5,857 6,163 6,265
Net income per share—basic $ 1.05 $ 1.35 $ 1.21
Net income per share—diluted $ 1.05 $ 1.31 $ 1.17
Antidilutive employee share-based awards, excluded 977 567 533
76 Cisco Systems, Inc.