Cisco 2009 Annual Report Download - page 29
Download and view the complete annual report
Please find page 29 of the 2009 Cisco annual report below. You can navigate through the pages in the report by either clicking on the pages listed below, or by using the keyword search tool below to find specific information within the annual report.-
 1
1 -
2
-
3
-
4
-
5
-
6
-
7
-
8
-
9
-
10
-
11
-
12
-
13
-
14
-
15
-
16
-
17
-
18
-
 19
19 -
 20
20 -
 21
21 -
 22
22 -
 23
23 -
 24
24 -
 25
25 -
 26
26 -
 27
27 -
 28
28 -
 29
29 -
 30
30 -
 31
31 -
 32
32 -
 33
33 -
 34
34 -
 35
35 -
 36
36 -
 37
37 -
 38
38 -
 39
39 -
40
-
41
-
42
-
43
-
44
-
45
-
46
-
47
-
48
-
49
-
50
-
51
-
52
-
53
-
54
-
55
-
56
-
57
-
58
-
59
-
60
-
61
-
62
-
63
-
64
-
65
-
66
-
67
-
68
-
69
-
70
-
71
-
72
-
73
-
74
-
75
-
76
-
77
-
78
-
79
-
80
-
81
-
82
-
83
-
84
 |
 |

Management’s Discussion and Analysis of Financial Condition and Results of Operations
For purchase acquisitions completed to date, the development of these acquired technologies remains a significant risk due to the
remaining efforts to achieve technological feasibility, rapidly changing customer markets, uncertain standards for new products, and
significant competitive threats. The nature of the efforts to develop these technologies into commercially viable products consists primarily
of planning, designing, experimenting, and testing activities necessary to determine that the technologies can meet market expectations,
including functionality and technical requirements. Failure to bring these products to market in a timely manner could result in a loss of
market share or a lost opportunity to capitalize on emerging markets and could have a material adverse impact on our business and
operating results.
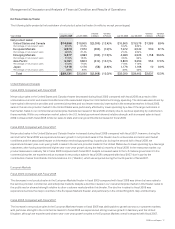
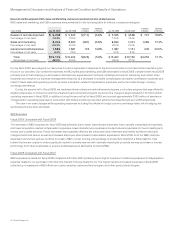
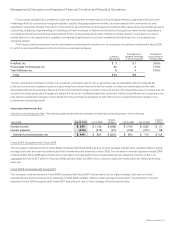
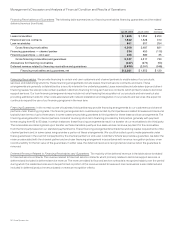
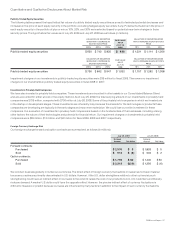
The following table summarizes the key assumptions underlying the valuation for our purchase acquisitions completed in fiscal 2009
for which in-process R&D was recorded (in millions, except percentages):
In-Process
R&D Expense
Estimated Cost to
Complete Technology
at Time of Acquisition
Risk-Adjusted
Discount Rate for
In-Process R&D
PostPath, Inc. $ 3 $ 1 20.0%
Pure Digital Technologies, Inc. 52 3 17.5%
Tidal Software, Inc. 8 4 37.0%
Total $63 $8
The key assumptions primarily consist of an expected completion date for the in-process projects; estimated costs to complete the
projects; revenue and expense projections, assuming the products have entered the market; and discount rates based on the risks
associated with the development lifecycle of the in-process technology acquired. Failure to achieve the expected levels of revenue and net
income from these products will negatively impact the return on investment expected at the time that the acquisitions were completed and
may result in impairment charges. Actual results from the purchase acquisitions to date did not have a material adverse impact on our
business and operating results.
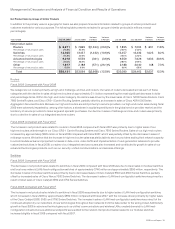
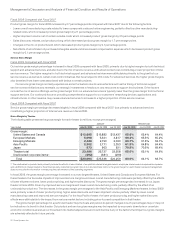
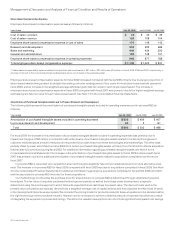
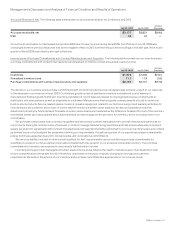
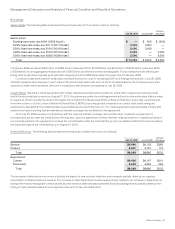
Interest and Other Income, Net
Interest Income (Expense), Net The following table presents the breakdown of interest income (expense), net (in millions):
Years Ended July 25, 2009 July 26, 2008
Variance
in Dollars July 26, 2008 July 28, 2007
Variance
in Dollars
Interest income $ 845 $ 1,143 $ (298) $ 1,143 $ 1,092 $ 51
Interest expense (346) (319) (27) (319) (377) 58
Interest income (expense), net $ 499 $ 824 $ (325) $ 824 $ 715 $ 109
Fiscal 2009 Compared with Fiscal 2008
The decrease in interest income in fiscal 2009 compared with fiscal 2008 was due to lower average interest rates, partially offset by higher
average total cash and cash equivalents and fixed income security balances in fiscal 2009. The increase in interest expense in fiscal 2009
compared with fiscal 2008 was primarily due to the higher average debt balances associated with the issuance of senior notes in an
aggregate amount of $4.0 billion in February 2009, partially offset by $500 million of senior unsecured notes which we retired when they
were due.
Fiscal 2008 Compared with Fiscal 2007
The increase in interest income in fiscal 2008 compared with fiscal 2007 was primarily due to higher average total cash and cash
equivalents and fixed income security balances in fiscal 2008, partially offset by lower average interest rates. The decrease in interest
expense in fiscal 2008 compared with fiscal 2007 was primarily due to lower average effective interest rates.
2009 Annual Report 27