Cisco 2004 Annual Report Download - page 55
Download and view the complete annual report
Please find page 55 of the 2004 Cisco annual report below. You can navigate through the pages in the report by either clicking on the pages listed below, or by using the keyword search tool below to find specific information within the annual report.-
 1
1 -
2
-
3
-
4
-
5
-
6
-
7
-
8
-
9
-
10
-
11
-
12
-
13
-
14
-
15
-
16
-
17
-
18
-
19
-
20
-
21
-
22
-
23
-
24
-
25
-
26
-
27
-
28
-
29
-
30
-
31
-
32
-
33
-
34
-
35
-
36
-
37
-
38
-
39
-
40
-
41
-
42
-
43
-
44
-
 45
45 -
 46
46 -
 47
47 -
 48
48 -
 49
49 -
 50
50 -
 51
51 -
 52
52 -
 53
53 -
 54
54 -
 55
55 -
 56
56 -
 57
57 -
 58
58 -
 59
59 -
 60
60 -
 61
61 -
 62
62 -
 63
63 -
 64
64 -
 65
65 -
66
-
67
 |
 |

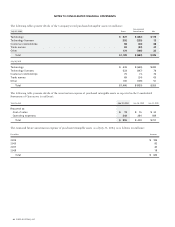
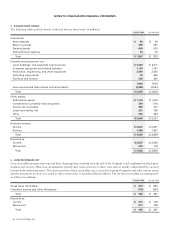
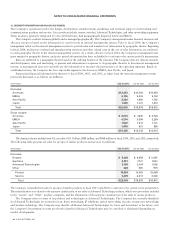
The change in unrealized gains and losses on investments, net of tax, during fiscal 2004, 2003, and 2002 included the effects of
the recognition of charges in the Consolidated Statements of Operations of $0, $412 million, and $858 million, pretax, respectively,
attributable to the impairment of certain publicly traded equity securities. The impairment charges were related to the declines in the
fair values of certain publicly traded equity investments below their cost basis that were judged to be other-than-temporary.
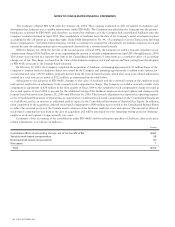
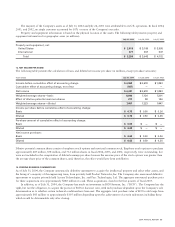
10. EMPLOYEE BENEFIT PLANS
Employee Stock Purchase Plan
The Company has an Employee Stock Purchase Plan, which includes its subplan, the International Employee Stock Purchase Plan
(together the “Purchase Plan”), under which 321.4 million shares of the Company’s common stock have been reserved for issuance.
Eligible employees may purchase a limited number of shares of the Company’s common stock at a discount of up to 15% of the
market value at certain plan-defined dates. The Purchase Plan terminates on January 3, 2010. In fiscal 2004, 2003, and 2002, the
shares issued under the Purchase Plan were 26 million, 23 million, and 22 million shares, respectively. At July 31, 2004, 138.6 million
shares were available for issuance under the Purchase Plan.
Employee Stock Option Plans
Stock Option Program Description The Company has two plans under which it grants options: the 1996 Stock Incentive Plan (the “1996
Plan”) and the 1997 Supplemental Stock Incentive Plan (the “Supplemental Plan”).
Stock option grants are designed to reward employees for their long-term contributions to the Company and provide incentives
for them to remain with the Company. The number and frequency of stock option grants are based on competitive practices, operating
results of the Company, and government regulations.
The maximum number of shares issuable over the term of the 1996 Plan is limited to 2.5 billion shares. Options granted under
the 1996 Plan have an exercise price equal to the fair market value of the underlying stock on the grant date and expire no later than
nine years from the grant date. The options will generally become exercisable for 20% or 25% of the option shares one year from
the date of grant and then ratably over the following 48 or 36 months, respectively. Certain other grants have utilized a 60-month
ratable vesting schedule. In addition, the Board of Directors, or other committee administering the plan, has the discretion to use a
different vesting schedule and has done so from time to time. Since the inception of the 1996 Plan, the Company has granted options to
virtually all employees, and the majority have been granted to employees below the vice president level.
In 1997, the Company adopted the Supplemental Plan, under which options can be granted or shares can be directly issued to
eligible employees. Officers and members of the Company’s Board of Directors are not eligible to participate in the Supplemental Plan.
Nine million shares have been reserved for issuance under the Supplemental Plan, of which 3 million options were granted. All option
grants have an exercise price equal to the fair market value of the underlying stock on the grant date.
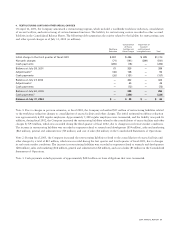
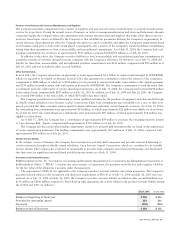
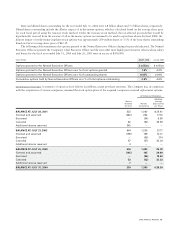
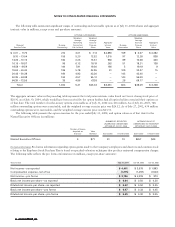
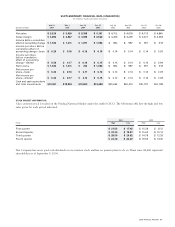
Distribution and Dilutive Effect of Options The following table illustrates the grant dilution and exercise dilution (in millions, except percentages):
Years Ended July 31, 2004 July 26, 2003
Shares of common stock outstanding 6,735 6,998
Granted and assumed 195 199
Canceled (52) (57)
Net options granted 143 142
Grant dilution(1) 2.1% 2.0%
Exercised 96 45
Exercise dilution(2) 1.4% 0.6%
Note 1: The percentage for grant dilution is computed based on net options granted as a percentage of shares of common stock outstanding.
Note 2: The percentage for exercise dilution is computed based on options exercised as a percentage of shares of common stock outstanding.
58 CISCO SYSTEMS, INC.
NOTES TO CONSOLIDATED FINANCIAL STATEMENTS