Cisco 2004 Annual Report Download - page 26
Download and view the complete annual report
Please find page 26 of the 2004 Cisco annual report below. You can navigate through the pages in the report by either clicking on the pages listed below, or by using the keyword search tool below to find specific information within the annual report.-
 1
1 -
2
-
3
-
4
-
5
-
6
-
7
-
8
-
9
-
10
-
11
-
12
-
13
-
14
-
15
-
 16
16 -
 17
17 -
 18
18 -
 19
19 -
 20
20 -
 21
21 -
 22
22 -
 23
23 -
 24
24 -
 25
25 -
 26
26 -
 27
27 -
 28
28 -
 29
29 -
 30
30 -
 31
31 -
 32
32 -
 33
33 -
 34
34 -
 35
35 -
 36
36 -
37
-
38
-
39
-
40
-
41
-
42
-
43
-
44
-
45
-
46
-
47
-
48
-
49
-
50
-
51
-
52
-
53
-
54
-
55
-
56
-
57
-
58
-
59
-
60
-
61
-
62
-
63
-
64
-
65
-
66
-
67
 |
 |

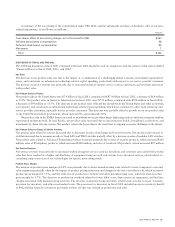
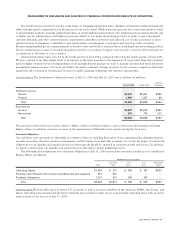
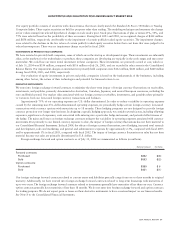
A summary of the accounting of the consolidation under FIN 46(R) and the subsequent purchase of Andiamo, after stock price
related adjustments, is as follows (in millions):
Amount
Cumulative effect of accounting change, net of tax benefit of $5 $567
Variable stock-based compensation 58
Deferred stock-based compensation 90
Net assets 7
Total $722
DISCUSSION OF FISCAL 2003 AND 2002
The following discussion of fiscal 2003 compared with fiscal 2002 should be read in conjunction with the section of this report entitled
“Financial Data for Fiscal 2004, 2003, and 2002.”
Net Sales
The decrease in net product sales was due to the impact of a combination of a challenging global economic environment, geopolitical
issues, and constraints on information technology-related capital spending, particularly with respect to our service provider customers.
The increase in service revenue was primarily due to increased technical support service contract initiations and renewals associated
with product sales.
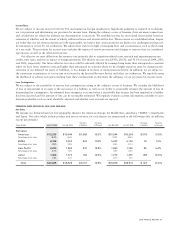
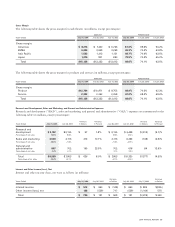
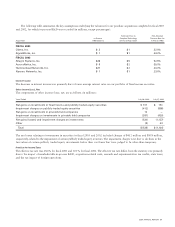
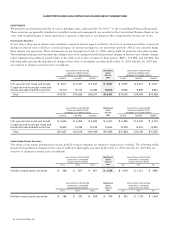
Net Product Sales by Theater
Net product sales in the United States were $7.4 billion in fiscal 2003, compared with $7.4 billion in fiscal 2002, a decrease of $69 million
or 0.9%. Net product sales in Americas International in fiscal 2003 were $759 million, compared with $858 million in fiscal 2002,
a decrease of $99 million or 11.5%. The decrease in net product sales reflected the slowdown in the United States and other economies,
overcapacity, and constraints on information technology-related capital spending, which have continued to affect both enterprise and
service provider customers, especially service provider customers. This decrease was partially offset by growth in our net product sales
to the United States federal government, which increased by approximately 20%.
Net product sales in the EMEA theater increased as incumbent service providers began deploying products and some enterprise markets
experienced modest growth. In Asia Pacific, net product sales increased due to infrastructure builds, broadband acceleration, and
investments by Asian telecom carriers. Net product sales in the Japan theater decreased due to ongoing economic challenges in the theater.
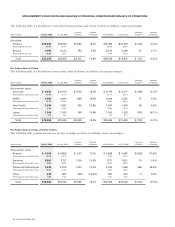
Net Product Sales by Groups of Similar Products
Net product sales related to routers decreased due to decreases in sales of midrange and low-end routers. Net product sales related to
switches increased due to increases in sales of fixed LAN and WAN switches partially offset by a decrease in sales of modular LAN switches.
Net product sales related to Advanced Technology products increased primarily due to sales of security products, which increased $160
million; sales of IP telephony products, which increased $148 million; and sales of wireless LAN products, which increased $95 million.
Net Service Revenue
Net service revenue increased due to increased technical support service contract initiations and renewals associated with product
sales that have resulted in a higher installed base of equipment being serviced and revenue from advanced services, which relates to
consulting support services of our technologies for specific networking needs.
Product Gross Margin
The increase in product gross margin of 8.2% was primarily due to lower manufacturing costs related to lower component costs and
value engineering partially offset by the impact of product pricing reductions and changes in the mix of products sold, which increased
product gross margin by 3.5%, and the reduction of production overhead and other manufacturing costs, which increased product
gross margin by 4.7%. The decrease in production overhead related to lower labor costs, depreciation on equipment, and facilities
charges associated with manufacturing activities. The decrease in manufacturing and other related costs was due to lower warranty,
provision for inventory, and other nonstandard costs. The provision for inventory in fiscal 2002 included an excess inventory benefit
of $422 million related to inventory previously written off that was utilized in production and sold.
2004 ANNUAL REPORT 29