Chrysler 2015 Annual Report Download - page 66
Download and view the complete annual report
Please find page 66 of the 2015 Chrysler annual report below. You can navigate through the pages in the report by either clicking on the pages listed below, or by using the keyword search tool below to find specific information within the annual report.-
 1
1 -
2
-
3
-
4
-
5
-
6
-
7
-
8
-
9
-
10
-
11
-
12
-
13
-
14
-
15
-
16
-
17
-
18
-
19
-
20
-
21
-
22
-
23
-
24
-
25
-
26
-
27
-
28
-
29
-
30
-
31
-
32
-
33
-
34
-
35
-
36
-
37
-
38
-
39
-
40
-
41
-
42
-
43
-
44
-
45
-
46
-
47
-
48
-
49
-
50
-
51
-
52
-
53
-
54
-
55
-
 56
56 -
 57
57 -
 58
58 -
 59
59 -
 60
60 -
 61
61 -
 62
62 -
 63
63 -
 64
64 -
 65
65 -
 66
66 -
 67
67 -
 68
68 -
 69
69 -
 70
70 -
 71
71 -
 72
72 -
 73
73 -
 74
74 -
 75
75 -
 76
76 -
77
-
78
-
79
-
80
-
81
-
82
-
83
-
84
-
85
-
86
-
87
-
88
-
89
-
90
-
91
-
92
-
93
-
94
-
95
-
96
-
97
-
98
-
99
-
100
-
101
-
102
-
103
-
104
-
105
-
106
-
107
-
108
-
109
-
110
-
111
-
112
-
113
-
114
-
115
-
116
-
117
-
118
-
119
-
120
-
121
-
122
-
123
-
124
-
125
-
126
-
127
-
128
-
129
-
130
-
131
-
132
-
133
-
134
-
135
-
136
-
137
-
138
-
139
-
140
-
141
-
142
-
143
-
144
-
145
-
146
-
147
-
148
-
149
-
150
-
151
-
152
-
153
-
154
-
155
-
156
-
157
-
158
-
159
-
160
-
161
-
162
-
163
-
164
-
165
-
166
-
167
-
168
-
169
-
170
-
171
-
172
-
173
-
174
-
175
-
176
-
177
-
178
-
179
-
180
-
181
-
182
-
183
-
184
-
185
-
186
-
187
-
188
-
189
-
190
-
191
-
192
-
193
-
194
-
195
-
196
-
197
-
198
-
199
-
200
-
201
-
202
-
203
-
204
-
205
-
206
-
207
-
208
-
209
-
210
-
211
-
212
-
213
-
214
-
215
-
216
-
217
-
218
-
219
-
220
-
221
-
222
-
223
-
224
-
225
-
226
-
227
-
228
-
229
-
230
-
231
-
232
-
233
-
234
-
235
-
236
-
237
-
238
-
239
-
240
-
241
-
242
-
243
-
244
-
245
-
246
-
247
-
248
-
249
-
250
-
251
-
252
-
253
-
254
-
255
-
256
-
257
-
258
-
259
-
260
-
261
-
262
-
263
-
264
-
265
-
266
-
267
-
268
-
269
-
270
-
271
-
272
-
273
-
274
-
275
-
276
-
277
-
278
-
279
-
280
-
281
-
282
-
283
-
284
-
285
-
286
-
287
-
288
 |
 |

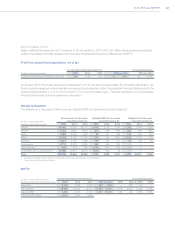
66 2015 | ANNUAL REPORT
Operating Results
Liquidity and Capital Resources
Liquidity Overview
We require significant liquidity in order to meet our obligations and fund our business. Short-term liquidity is required
to purchase raw materials, parts and components for vehicle production, as well as to fund selling, administrative,
research and development, and other expenses. In addition to our general working capital and operational needs, we
expect to use significant amounts of cash for the following purposes: (i)capital expenditures to support our existing
and future products, (ii)principal and interest payments under our financial obligations and (iii)pension and employee
benefit payments. We make capital investments in the regions in which we operate primarily related to initiatives to
introduce new products, enhance manufacturing efficiency, improve capacity and for maintenance and environmental
compliance. Our capital expenditures in 2016 are expected to be in line with 2015 capital expenditures and within the
range of €8.5 to €9 billion, which we plan to fund primarily with cash generated from our operating activities, as well as
with credit lines provided to certain of our Group entities.
Our business and results of operations depend on our ability to achieve certain minimum vehicle sales volumes. As
is typical for an automotive manufacturer, we have significant fixed costs and therefore, changes in our vehicle sales
volume can have a significant effect on profitability and liquidity. We generally receive payment for sales of vehicles to
dealers and distributors, shortly after shipment, whereas there is a lag between the time we receive parts and materials
from our suppliers and the time we are required to pay for them. Therefore, during periods of increasing vehicle sales,
there is generally a corresponding positive impact on our cash flow and liquidity. Conversely, during periods in which
vehicle sales decline, there is generally a corresponding negative impact on our cash flow and liquidity. Delays in
shipments of vehicles, including delays in shipments in order to address quality issues, tend to negatively affect our
cash flow and liquidity. In addition, the timing of our collections of receivables for export sales of vehicles, fleet sales
and part sales tend to be longer due to different payment terms. Although we regularly enter into factoring transactions
for such receivables in certain countries in order to anticipate collections and transfer relevant risks to the factor, a
change in volumes of such sales may cause fluctuations in our working capital. The increased internationalization of
our product portfolio may also affect our working capital requirements as there may be an increased requirement to
ship vehicles to countries different from where they are produced. Finally, working capital can be affected by the trend
and seasonality of sales under vehicle buy-back programs.
Management believes that the funds currently available, in addition to those funds that will be generated from operating
and financing activities, will enable the Group to meet its obligations and fund its businesses including funding planned
investments, working capital needs as well as fulfill its obligations to repay its debts in the ordinary course of business.
Liquidity needs are met primarily through cash generated from operations, including the sale of vehicles, service and
parts to dealers, distributors and other consumers worldwide.
The operating cash management and liquidity investment of the Group are centrally coordinated with the objective of
ensuring effective and efficient management of the Group’s funds. The companies raise capital in the financial markets
through various funding sources.
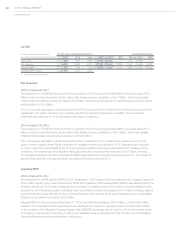
FCA US continues to manage its liquidity independently from the rest of the Group. Intercompany financing from FCA
US to other Group entities is not restricted other than through the application of covenants requiring that transactions
with related parties be conducted at arm’s length terms or be approved by a majority of the “disinterested” members
of the Board of Directors of FCA US. In addition, certain of FCA US’s financing agreements place restrictions on the
distributions which it is permitted to make. In particular, dividend distributions, other than certain exceptions including
certain permitted distributions and distributions with respect to taxes, are generally limited to an amount not to exceed
50 percent of cumulative consolidated net income (as defined in the financing agreements) from January 2012 less
distributions paid to date (refer to the section —Capital Market - Senior Credit Facilities - FCA US below).
FCA has not provided any guarantee, commitment or similar obligation in relation to any of FCA US’s financial indebtedness,
nor has it assumed any kind of obligation or commitment to fund FCA US. However, with the replacement of the prior FCA
revolving credit facilities with the new FCA revolving credit facilities entered into in June 2015, FCA no longer has limitations
in providing funding to FCA US. Certain notes issued by FCA and its subsidiaries (other than FCA US and its subsidiaries)
include covenants which may be affected by circumstances related to FCA US, in particular there are cross-default clauses
which may accelerate repayments in the event that FCA US fails to pay certain of its debt obligations.