Chrysler 2015 Annual Report Download - page 179
Download and view the complete annual report
Please find page 179 of the 2015 Chrysler annual report below. You can navigate through the pages in the report by either clicking on the pages listed below, or by using the keyword search tool below to find specific information within the annual report.-
 1
1 -
 2
2 -
 3
3 -
 4
4 -
 5
5 -
 6
6 -
 7
7 -
 8
8 -
 9
9 -
 10
10 -
 11
11 -
 12
12 -
 13
13 -
 14
14 -
 15
15 -
 16
16 -
 17
17 -
 18
18 -
 19
19 -
 20
20 -
 21
21 -
 22
22 -
 23
23 -
 24
24 -
 25
25 -
 26
26 -
 27
27 -
 28
28 -
 29
29 -
 30
30 -
 31
31 -
 32
32 -
 33
33 -
 34
34 -
 35
35 -
 36
36 -
 37
37 -
 38
38 -
 39
39 -
 40
40 -
 41
41 -
 42
42 -
 43
43 -
 44
44 -
 45
45 -
 46
46 -
 47
47 -
 48
48 -
 49
49 -
 50
50 -
 51
51 -
 52
52 -
 53
53 -
 54
54 -
 55
55 -
 56
56 -
 57
57 -
 58
58 -
 59
59 -
 60
60 -
 61
61 -
 62
62 -
 63
63 -
 64
64 -
 65
65 -
 66
66 -
 67
67 -
 68
68 -
 69
69 -
 70
70 -
 71
71 -
 72
72 -
 73
73 -
 74
74 -
 75
75 -
 76
76 -
 77
77 -
 78
78 -
 79
79 -
 80
80 -
 81
81 -
 82
82 -
 83
83 -
 84
84 -
 85
85 -
 86
86 -
 87
87 -
 88
88 -
 89
89 -
 90
90 -
 91
91 -
 92
92 -
 93
93 -
 94
94 -
 95
95 -
 96
96 -
 97
97 -
 98
98 -
 99
99 -
 100
100 -
 101
101 -
 102
102 -
 103
103 -
 104
104 -
 105
105 -
 106
106 -
 107
107 -
 108
108 -
 109
109 -
 110
110 -
 111
111 -
 112
112 -
 113
113 -
 114
114 -
 115
115 -
 116
116 -
 117
117 -
 118
118 -
 119
119 -
 120
120 -
 121
121 -
 122
122 -
 123
123 -
 124
124 -
 125
125 -
 126
126 -
 127
127 -
 128
128 -
 129
129 -
 130
130 -
 131
131 -
 132
132 -
 133
133 -
 134
134 -
 135
135 -
 136
136 -
 137
137 -
 138
138 -
 139
139 -
 140
140 -
 141
141 -
 142
142 -
 143
143 -
 144
144 -
 145
145 -
 146
146 -
 147
147 -
 148
148 -
 149
149 -
 150
150 -
 151
151 -
 152
152 -
 153
153 -
 154
154 -
 155
155 -
 156
156 -
 157
157 -
 158
158 -
 159
159 -
 160
160 -
 161
161 -
 162
162 -
 163
163 -
 164
164 -
 165
165 -
 166
166 -
 167
167 -
 168
168 -
 169
169 -
 170
170 -
 171
171 -
 172
172 -
 173
173 -
 174
174 -
 175
175 -
 176
176 -
 177
177 -
 178
178 -
 179
179 -
 180
180 -
 181
181 -
 182
182 -
 183
183 -
 184
184 -
 185
185 -
 186
186 -
 187
187 -
 188
188 -
 189
189 -
 190
190 -
 191
191 -
 192
192 -
 193
193 -
 194
194 -
 195
195 -
 196
196 -
 197
197 -
 198
198 -
 199
199 -
 200
200 -
 201
201 -
 202
202 -
 203
203 -
 204
204 -
 205
205 -
 206
206 -
 207
207 -
 208
208 -
 209
209 -
 210
210 -
 211
211 -
 212
212 -
 213
213 -
 214
214 -
 215
215 -
 216
216 -
 217
217 -
 218
218 -
 219
219 -
 220
220 -
 221
221 -
 222
222 -
 223
223 -
 224
224 -
 225
225 -
 226
226 -
 227
227 -
 228
228 -
 229
229 -
 230
230 -
 231
231 -
 232
232 -
 233
233 -
 234
234 -
 235
235 -
 236
236 -
 237
237 -
 238
238 -
 239
239 -
 240
240 -
 241
241 -
 242
242 -
 243
243 -
 244
244 -
 245
245 -
 246
246 -
 247
247 -
 248
248 -
 249
249 -
 250
250 -
 251
251 -
 252
252 -
 253
253 -
 254
254 -
 255
255 -
 256
256 -
 257
257 -
 258
258 -
 259
259 -
 260
260 -
 261
261 -
 262
262 -
 263
263 -
 264
264 -
 265
265 -
 266
266 -
 267
267 -
 268
268 -
 269
269 -
 270
270 -
 271
271 -
 272
272 -
 273
273 -
 274
274 -
 275
275 -
 276
276 -
 277
277 -
 278
278 -
 279
279 -
 280
280 -
 281
281 -
 282
282 -
 283
283 -
 284
284 -
 285
285 -
 286
286 -
 287
287 -
 288
288
 |
 |

2015 | ANNUAL REPORT 179
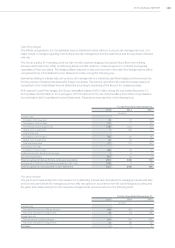
The following table presents the allocation of Goodwill across our reportable segments:
At December 31,
2015 2014
(€ million)
NAFTA 9,312 8,350
APAC 1,210 1,085
LATAM 583 517
EMEA 276 233
Ferrari(1) —786
Components 62 52
Other activities 54 36
Total Goodwill 11,497 11,059
(1) Goodwill related to Ferrari was reclassified to Assets held for distribution; refer to the section - Principal Activities above
11. Other intangible assets
Externally
acquired
development
costs
Development
costs
internally
generated
Patents,
concessions,
licenses and
credits
Other
intangible
assets Total
(€ million)
Gross carrying amount at January 1, 2014 6,859 4,654 2,285 621 14,419
Additions 1,542 725 350 89 2,706
Divestitures (8) (36) (38) (6) (88)
Translation differences and other changes 239 168 207 4 618
Balance at December 31, 2014 8,632 5,511 2,804 708 17,655
Additions 1,459 1,200 247 130 3,036
Divestitures — (46) (12) (10) (68)
Translation differences and other changes 430 (178) 212 (72) 392
Transfer to Assets held for distribution (1,259) — (131) (55) (1,445)
Balance at December 31, 2015 9,262 6,487 3,120 701 19,570
Accumulated amortization and impairment
losses Balance at January 1, 2014 3,165 2,678 1,086 416 7,345
Amortization 648 409 225 49 1,331
Impairment losses and asset write-offs 46 36 — — 82
Divestitures (6) (30) (33) (4) (73)
Translation differences and other changes (84) 152 59 8 135
Balance at December 31, 2014 3,769 3,245 1,337 469 8,820
Amortization 857 452 301 54 1,664
Impairment losses and asset write-offs 187 34 — 2 223
Divestitures — (34) (11) (9) (54)
Translation differences and other changes 165 (80) 73 (39) 119
Transfer to Assets held for distribution (985) — (117) (46) (1,148)
Balance at December 31, 2015 3,993 3,617 1,583 431 9,624
Carrying amount at December 31, 2014 4,863 2,266 1,467 239 8,835
Carrying amount at December 31, 2015 5,269 2,870 1,537 270 9,946
Additions of €3,036 million in 2015 (€2,706 million in 2014) included development costs of €2,659 million (€2,267
million in 2014), consisting primarily of material costs and personnel related expenses relating to engineering, design
and development focused on content enhancement of existing vehicles, new models and powertrain programs,
as well as the investment for the development of Alfa Romeo vehicles. Of the €223 million impairment losses and
asset write-offs in 2015, €176 million related to the impairment of capitalized development costs that had no future
economic benefit as a result of the Group’s plan to realign a portion of its manufacturing capacity in NAFTA to better
meet market demand for Ram pickups and Jeep vehicles within the Group’s existing plant infrastructure.
