Chrysler 2005 Annual Report Download - page 11
Download and view the complete annual report
Please find page 11 of the 2005 Chrysler annual report below. You can navigate through the pages in the report by either clicking on the pages listed below, or by using the keyword search tool below to find specific information within the annual report.-
 1
1 -
 2
2 -
 3
3 -
 4
4 -
 5
5 -
 6
6 -
 7
7 -
 8
8 -
 9
9 -
 10
10 -
 11
11 -
 12
12 -
 13
13 -
 14
14 -
 15
15 -
 16
16 -
 17
17 -
 18
18 -
 19
19 -
 20
20 -
 21
21 -
 22
22 -
23
-
24
-
25
-
26
-
27
-
28
-
29
-
30
-
31
-
32
-
33
-
34
-
35
-
36
-
37
-
38
-
39
-
40
-
41
-
42
-
43
-
44
-
45
-
46
-
47
-
48
-
49
-
50
-
51
-
52
-
53
-
54
-
55
-
56
-
57
-
58
-
59
-
60
-
61
-
62
-
63
-
64
-
65
-
66
-
67
-
68
-
69
-
70
-
71
-
72
-
73
-
74
-
75
-
76
-
77
-
78
-
79
-
80
-
81
-
82
-
83
-
84
-
85
-
86
-
87
-
88
-
89
-
90
-
91
-
92
-
93
-
94
-
95
-
96
-
97
-
98
-
99
-
100
-
101
-
102
-
103
-
104
-
105
-
106
-
107
-
108
-
109
-
110
-
111
-
112
-
113
-
114
-
115
-
116
-
117
-
118
-
119
-
120
-
121
-
122
-
123
-
124
-
125
-
126
-
127
-
128
-
129
-
130
-
131
-
132
-
133
-
134
-
135
-
136
-
137
-
138
-
139
-
140
-
141
-
142
-
143
-
144
-
145
-
146
-
147
-
148
-
149
-
150
-
151
-
152
-
153
-
154
-
155
-
156
-
157
-
158
-
159
-
160
-
161
-
162
-
163
-
164
-
165
-
166
-
167
-
168
-
169
-
170
-
171
-
172
-
173
-
174
-
175
-
176
-
177
-
178
-
179
-
180
-
181
-
182
-
183
-
184
-
185
-
186
-
187
-
188
-
189
-
190
-
191
-
192
-
193
-
194
-
195
-
196
-
197
-
198
-
199
-
200
-
201
-
202
-
203
-
204
-
205
-
206
-
207
-
208
-
209
-
210
-
211
-
212
-
213
-
214
-
215
-
216
-
217
-
218
-
219
-
220
-
221
-
222
-
223
-
224
-
225
-
226
-
227
-
228
-
229
-
230
-
231
-
232
-
233
-
234
-
235
-
236
-
237
-
238
-
239
-
240
-
241
-
242
-
243
-
244
-
245
-
246
-
247
-
248
-
249
-
250
-
251
-
252
-
253
-
254
-
255
-
256
-
257
-
258
-
259
-
260
-
261
-
262
-
263
-
264
-
265
-
266
-
267
-
268
-
269
-
270
-
271
-
272
-
273
-
274
-
275
-
276
-
277
-
278
 |
 |

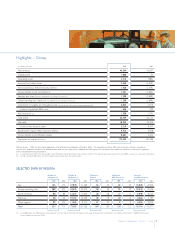
10 Reporton Operations Highlights – Group
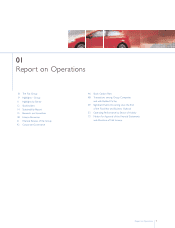
01 Report on Operations
Fiat Group recorded revenues of 46.5 billion euros in 2005, up 2%
from 45.6 billion euros in 2004. All automotive Sectors posted
improvements, apart from a slight decrease (-0.8%) at Fiat Auto as
arecovery in car sales volumes in the last quarter was insufficient
to offset the trend of the first nine months, when sales slowed
down ahead of new model launches.
Group trading profit for the year came in at 1 billion euros,
compared with 50 million euros in 2004.The 950 million euro
improvement in trading profit reflected a 541 million euro
reduction in trading losses at Fiat Auto and the positive
performance of all other industrial Sectors, which met or exceeded
their trading margin targets (trading profit as a percentage of
revenues). In particular, trading margins were as follows: Fiat Auto
-1.4%, in line with the target set; CNH 6.8%, against a target of
6/6.5%; Iveco 4.4%, higher than its 4% target; the Components
and Production Systems business area 3.7%, higher than its
3% target.
Operating result for the year was positive by2.2 billion euros,
compared with an operating loss of 585 million euros in 2004.
The year benefited from the improvement in trading profit
and, more particularly, from the gain of 1.1 billion euros from
the General Motors settlement and the gain realised on the sale
of the investment in Italenergia Bis (878 million euros).
Income before taxes was 2.3 billion euros, compared with a loss
of 1.6 billion euros in 2004.The 3.9 billion euro improvement
reflected an increase in operating result (+2.8 billion euros), the
unusual financial income of 858 million euros associated with the
capital increase to service the Mandatory Convertible Facility
and a decrease in net financial expenses.
Consolidated net income (Group and third parties) amounted
to 1.4 billion euros, against a loss of 1.6 billion euros in 2004.
Net industrial debt amounted to 3.2 billion euros, showing
a decrease during the year of approximately 6.2 billion euros,
mainly reflecting the conversion of the Mandatory Convertible
Facility, the repayment of financial debt related to the Italenergia
Bis transaction, and the receipt of the General Motorsindemnity
following the settlement of the Master Agreement.
The Group’s cash position at December 31, 2005 was
approximately 7 billion euros, up from 6.1 billion euros at January
1, 2005, after the utilisation of 1.9 billion euros of cash for the
repayment of bonds.