Chesapeake Energy 2014 Annual Report Download - page 5
Download and view the complete annual report
Please find page 5 of the 2014 Chesapeake Energy annual report below. You can navigate through the pages in the report by either clicking on the pages listed below, or by using the keyword search tool below to find specific information within the annual report.-
 1
1 -
 2
2 -
 3
3 -
 4
4 -
 5
5 -
 6
6 -
 7
7 -
 8
8 -
 9
9 -
 10
10 -
 11
11 -
 12
12 -
 13
13 -
 14
14 -
 15
15 -
 16
16 -
17
-
18
-
19
-
20
-
21
-
22
-
23
-
24
-
25
-
26
-
27
-
28
-
29
-
30
-
31
-
32
-
33
-
34
-
35
-
36
-
37
-
38
-
39
-
40
-
41
-
42
-
43
-
44
-
45
-
46
-
47
-
48
-
49
-
50
-
51
-
52
-
53
-
54
-
55
-
56
-
57
-
58
-
59
-
60
-
61
-
62
-
63
-
64
-
65
-
66
-
67
-
68
-
69
-
70
-
71
-
72
-
73
-
74
-
75
-
76
-
77
-
78
-
79
-
80
-
81
-
82
-
83
-
84
-
85
-
86
-
87
-
88
-
89
-
90
-
91
-
92
-
93
-
94
-
95
-
96
-
97
-
98
-
99
-
100
-
101
-
102
-
103
-
104
-
105
-
106
-
107
-
108
-
109
-
110
-
111
-
112
-
113
-
114
-
115
-
116
-
117
-
118
-
119
-
120
-
121
-
122
-
123
-
124
-
125
-
126
-
127
-
128
-
129
-
130
-
131
-
132
-
133
-
134
-
135
-
136
-
137
-
138
-
139
-
140
-
141
-
142
-
143
-
144
-
145
-
146
-
147
-
148
-
149
-
150
-
151
-
152
-
153
-
154
-
155
-
156
-
157
-
158
-
159
-
160
-
161
-
162
-
163
-
164
-
165
-
166
-
167
-
168
-
169
-
170
-
171
-
172
-
173
 |
 |

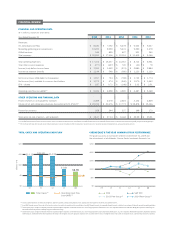
$5
$10
$15
$20
billions of $
$0
10 11 12 13 14
$14.2B
$7.8B
$6.7B
Total Capex(1) Operating Cash Flow
(non-GAAP) (2)
$5.0B
$14.1B $14.6B
FINANCIAL REVIEW
TOTAL CAPEX AND OPERATING CASH FLOW
FINANCIAL AND OPERATING DATA
($ in millions, except per share data)
(a) A non-GAAP nancial measure. Please refer to the Investors section of our website at www.chk.com for reconciliations of non-GAAP nancial measures to comparable nancial measures calculated in accordance with generally accepted accounting principles.
(b) PV-10 is the present value (10% discount rate) of estimated future gross revenues to be generated from the production of proved reserves, net of production and future development costs, using assumed prices and costs.
Years Ended December 31 2014 2013 2012 2011 2010
Revenues:
Oil, natural gas and NGL $ 8,180 $ 7,052 $ 6,278 $ 6,024 $ 5,647
Marketing, gathering and compression 12,225 9,559 5,431 5,090 3,479
Oileld services 546 895 607 521 240
Total revenues $ 20,951 $ 17,506 $ 12,316 $ 11,635 $ 9,366
Total operating expenses $ 17,474 $ 15,437 $ 14,010 $ 8,714 $ 6,561
Total other income (expense) $ (277 ) $ (627 ) $ 720 $ (41 ) $ 79
Income (loss) before income taxes $ 3,200 $ 1,442 $ (974 ) $ 2,880 $ 2,884
Income tax expense (benet) $ 1,144 $ 548 $ (380 ) $ 1,123 $ 1,110
Net income (loss) attributable to Chesapeake $ 1,917 $ 724 $ (769 ) $ 1,742 $ 1,774
Net income (loss) available to common stockholders $ 1,273 $ 474 $ (940 ) $ 1,570 $ 1,663
EPS – diluted $ 1.87 $ 0.73 $ (1.46 ) $ 2.32 $ 2.51
Operating cash ow (non-GAAP)(a) $ 5,026 $ 4,958 $ 3,920 $ 4,487 $ 5,169
OTHER OPERATING AND FINANCIAL DATA
Proved reserves in oil equivalents (mmboe) 2,469 2,678 2,615 3,132 2,849
Future net oil and natural gas revenues discounted at 10% (PV-10)(b) $ 22,012 $ 21,676 $ 17,773 $ 19,878 $ 15,146
Production (mmboe) 258 244 237 199 173
Stock price (at end of period – split adjusted) $ 19.47 $ 27.14 $ 16.62 $ 22.29 $ 25.91
(1) Includes capital expenditures for drilling and completions, property acquisitions, geological and geophysical costs, property, plant and equipment, investments and capitalized interest.
(2) A non-GAAP nancial measure. Please refer to the Investors section of our website at www.chk.com for reconciliations of non-GAAP nancial measures to comparable nancial measures calculated in accordance with generally accepted accounting principles.
(3) The 2013 peer group is comprised of Anadarko Petroleum Corporation, Apache Corporation,Continental Resources, Inc., Devon Energy Corporation, EOG Resources, Inc., Hess Corporation, Marathon Oil Corporation, Murphy Oil Corporation, Noble Energy, Inc.,
Occidental Petroleum Corporation, SandRidge Energy and Southwestern Energy.
(4) The 2014 peer group is comprised of Anadarko Petroleum Corporation, Apache Corporation,Continental Resources, Inc., Devon Energy Corporation, Encana Corporation, EOG Resources, Inc., Hess Corporation, Marathon Oil Corporation, Murphy Oil Corporation,
Noble Energy, Inc. and Occidental Petroleum Corporation. The change in the companies in our peer group was designed to more accurately show the returns of companies that are more similar to Chesapeake in size, scope and nature of business operations.
CHESAPEAKE’S FIVE-YEAR COMMON STOCK PERFORMANCE
The graph assumes an investment of $100 on December 31, 2009 and
the reinvestment of all dividends. Source: Zacks Investment Research, Inc.
$50
$100
$150
$200
$250
$0
CHK S&P 500
2013 Peer Group(3) 2014 Peer Group(4)
09 11 12 13 1410