Chesapeake Energy 2014 Annual Report Download - page 14
Download and view the complete annual report
Please find page 14 of the 2014 Chesapeake Energy annual report below. You can navigate through the pages in the report by either clicking on the pages listed below, or by using the keyword search tool below to find specific information within the annual report.-
 1
1 -
2
-
3
-
 4
4 -
 5
5 -
 6
6 -
 7
7 -
 8
8 -
 9
9 -
 10
10 -
 11
11 -
 12
12 -
 13
13 -
 14
14 -
 15
15 -
 16
16 -
 17
17 -
 18
18 -
 19
19 -
 20
20 -
 21
21 -
 22
22 -
 23
23 -
 24
24 -
25
-
26
-
27
-
28
-
29
-
30
-
31
-
32
-
33
-
34
-
35
-
36
-
37
-
38
-
39
-
40
-
41
-
42
-
43
-
44
-
45
-
46
-
47
-
48
-
49
-
50
-
51
-
52
-
53
-
54
-
55
-
56
-
57
-
58
-
59
-
60
-
61
-
62
-
63
-
64
-
65
-
66
-
67
-
68
-
69
-
70
-
71
-
72
-
73
-
74
-
75
-
76
-
77
-
78
-
79
-
80
-
81
-
82
-
83
-
84
-
85
-
86
-
87
-
88
-
89
-
90
-
91
-
92
-
93
-
94
-
95
-
96
-
97
-
98
-
99
-
100
-
101
-
102
-
103
-
104
-
105
-
106
-
107
-
108
-
109
-
110
-
111
-
112
-
113
-
114
-
115
-
116
-
117
-
118
-
119
-
120
-
121
-
122
-
123
-
124
-
125
-
126
-
127
-
128
-
129
-
130
-
131
-
132
-
133
-
134
-
135
-
136
-
137
-
138
-
139
-
140
-
141
-
142
-
143
-
144
-
145
-
146
-
147
-
148
-
149
-
150
-
151
-
152
-
153
-
154
-
155
-
156
-
157
-
158
-
159
-
160
-
161
-
162
-
163
-
164
-
165
-
166
-
167
-
168
-
169
-
170
-
171
-
172
-
173
 |
 |

6
___________________________________________
(a) Oil equivalent is based on six mcf of natural gas to one barrel of oil or one barrel of NGL. This ratio reflects an
energy content equivalency and not a price or revenue equivalency.
(b) Realized gains and losses include the following items: (i) settlements of undesignated derivatives related to current
period production revenues, (ii) prior period settlements for option premiums and for early-terminated derivatives
originally scheduled to settle against current period production revenues, and (iii) gains and losses related to de-
designated cash flow hedges originally designated to settle against current period production revenues. Unrealized
gains and losses include the change in fair value of open derivatives scheduled to settle against future period
production revenues offset by amounts reclassified as realized gains and losses during the period.
(c) Includes revenue and operating costs. See Results of Operations - Depreciation and Amortization of Other Assets
in Item 7 of Part II of this report for details of the depreciation and amortization associated with our marketing,
gathering and compression and former oilfield services operating segments.
(d) Includes stock-based compensation and excludes restructuring and other termination costs.
(e) Includes the effects of realized (gains) losses from interest rate derivatives, excludes the effects of unrealized
(gains) losses from interest rate derivatives, and is shown net of amounts capitalized.
Oil, Natural Gas and NGL Reserves
The tables below set forth information as of December 31, 2014 with respect to our estimated proved reserves,
the associated estimated future net revenue and present value (discounted at an annual rate of 10%) of estimated
future net revenue before and after future income taxes (standardized measure). Neither the pre-tax present value of
estimated future net revenue nor the after-tax standardized measure is intended to represent the current market value
of the estimated oil, natural gas and NGL reserves we own. All of our estimated oil and natural gas reserves are located
within the United States.
December 31, 2014
Oil Natural Gas NGL Total
(mmbbl) (bcf) (mmbbl) (mmboe)
Proved developed 229 8,615 198 1,864
Proved undeveloped 192 2,077 68 605
Total proved(a) 421 10,692 266 2,469
Proved
Developed Proved
Undeveloped Total
Proved
($ in millions)
Estimated future net revenue(b) $ 33,591 $ 13,534 $ 47,125
Present value of estimated future net revenue(b) $ 17,024 $ 4,988 $ 22,012
Standardized measure(b)(c) $ 17,133
Operating Division Oil Natural
Gas NGL Oil
Equivalent
Percent of
Proved
Reserves Present
Value
(mmbbl) (bcf) (mmbbl) (mmboe) ($ millions)
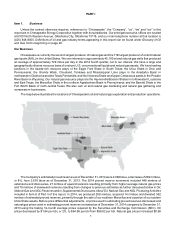
Southern 372 6,882 182 1,701 69% $ 15,372
Northern 49 3,810 84 768 31% 6,640
Total 421 10,692 266 2,469 100% $ 22,012 (b)
___________________________________________
(a) Includes 2 mmbbl of oil, 46 bcf of natural gas and 5 mmbbl of NGL reserves owned by the Chesapeake Granite
Wash Trust, 1 mmbbl of oil, 22 bcf of natural gas and 2 mmbbl of NGL of which are attributable to the noncontrolling
interest holders.
(b) Estimated future net revenue represents the estimated future gross revenue to be generated from the production
of proved reserves, net of estimated production and future development costs, using prices and costs under
existing economic conditions as of December 31, 2014. For the purpose of determining "prices", we used the
unweighted arithmetic average of the prices on the first day of each month within the 12-month period ended