Chesapeake Energy 2003 Annual Report Download - page 6
Download and view the complete annual report
Please find page 6 of the 2003 Chesapeake Energy annual report below. You can navigate through the pages in the report by either clicking on the pages listed below, or by using the keyword search tool below to find specific information within the annual report.
Performance
–it’s what the cover of our 2003 Annual Report is all about, it’s what Chesapeake is all about and it’s what
all business should be about. The expectation of exceptional
performance
is why you (and we) own Chesapeake stock, and
the delivery of exceptional
performance
is management’s #1 responsibility. However, because the natural gas exploration
and production (E&P) business is highly competitive and the prices received for the products we sell are extremely volatile,
consistent
performance
in delivering shareholder value in our industry is not easy to achieve.
Accordingly, in this year’s letter, we focus not only on Chesapeake’s
performance
during 2003, but also on the company’s
track record of
performance
during the 11 years since our IPO in February 1993. We will also discuss how we have posi-
tioned Chesapeake to continue delivering exceptional
performance
to our shareholders in the years ahead.
Performance
Through Operational and Financial Achievement First, let’s review our operational and financial
performance
in 2003, which by almost all measures, was our best year ever. We began the year with a full head of steam
from our ONEOK and El Paso acquisitions ($800 million of first class properties in the Mid-Continent), made a number of
important gas discoveries through the drillbit, dramatically improved our balance sheet and then ended the year with our
Laredo and Concho acquisitions ($620 million of excellent properties in the Mid-Continent, Permian Basin and South Texas
areas). These acquisitions and several others announced earlier this month have provided us with an especially strong start
to 2004.
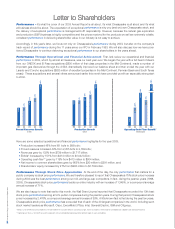
Here are some selected operational and financial
performance
highlights for the year 2003:
•Production increased 48% from181 bcfe to 268 bcfe;
•Proved reserves increased 44% from 2,205 bcfe to 3,169 bcfe;
•Revenues grew by 132% from $739 million to $1.717 billion;
•Ebitda* increased by 151% from $414 million to $1.042 billion;
•Operating cash flow** grew by 119% from $413 million to $904 million;
•Net income to common shareholders grew by 863% from $30 million to $291 million, and;
•Shareholders’ equity increased by 91% from $908 million to $1.733 billion.
Performance
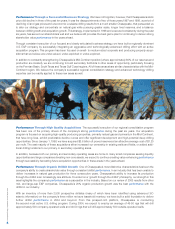
Through Stock Price Appreciation At the end of the day, the only
performance
that matters for a
public company is stock price
performance
. We are therefore pleased to report that Chesapeake’s 75% stock price increase
during 2003 was the best
performance
among our mid- and large-cap competitors. In fact, during the past six years (1998-
2003), Chesapeake’s stock price
performance
leads our entire industry with an increase of 1,345%, or a compound average
annual increase of 71%.
We are also happy to note that earlier this month, the Wall Street Journal reported that Chesapeake recorded the 13th best
stock price
performance
among all U.S. public companies during the past ten years. During that period, Chesapeake’s stock
price increased by 2,476%, a compound average annual increase of 39%. A little known fact is that during the past ten years,
Chesapeake’s stock price
performance
has exceeded that of each of the 30 largest companies in the world, including such
stock market leaders as Microsoft, Cisco, ExxonMobil, Pfizer, Intel, General Electric, IBM and Citigroup.
Letter to Shareholders
Chesapeake Energy Corporation Annual Report 2003
2
99
$ in thousandsIn bcfeIn bcfe
1,206
00
1,355 +12%
+31%
+24%
+44%
01
1,780
02
2,205
03
3,169
Proved Reserves Growth
99
133.5
00
134.2 +1%
+20%
+12%
+48%
01
161.5
02
181.5
03
268.3
Production Growth
99
$ 138.7
00
$ 305.8 +120%
+70%
-20%
+119%
01
$ 518.6
02
$ 412.5
03
$ 903.9
Operating Cash Flow Growth**
* Ebitda is a non-GAAP measure that represents net income before the cumulative effect of accounting changes, income tax expense, interest expense and depreciation, depletion and amortization expense.
** Operating cash flow is a non-GAAP measure that represents net cash provided by operating activities before changes in assets and liabilities.

