Chesapeake Energy 2003 Annual Report Download - page 3
Download and view the complete annual report
Please find page 3 of the 2003 Chesapeake Energy annual report below. You can navigate through the pages in the report by either clicking on the pages listed below, or by using the keyword search tool below to find specific information within the annual report.-
 1
1 -
 2
2 -
 3
3 -
 4
4 -
 5
5 -
 6
6 -
 7
7 -
 8
8 -
 9
9 -
 10
10 -
 11
11 -
 12
12 -
 13
13 -
 14
14 -
15
-
16
 |
 |

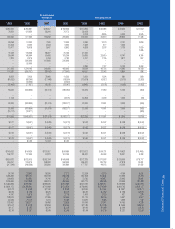
Financial Data ($ in thousands, except per share data)
Oil and gas sales
Oil and gas marketing sales
Oil and gas service operations
Total revenues
Operating costs:
Production expenses
Production taxes
General and administrative
Provision for legal settlements
Oil and gas marketing expenses
Oil and gas depreciation, depletion and amortization
Depreciation and amortization of other assets
Impairment of oil and gas properties
Impairment of other assets
Oil and gas service operations
Total operating costs
Income (loss) from operations
Other income (expense):
Interest and other income
Interest expense
Miscellaneous gains (losses)
Total other income (expense)
Income (loss) before income taxes and cumulative effect
of accounting change
Income tax expense (benefit):
Current
Deferred
Net income (loss) before cumulative effect of accounting
change, net of tax
Cumulative effect of accounting change, net of tax
Net Income (loss)
Preferred stock dividends
Gain on redemption of preferred stock
Net income (loss) available to common shareholders
Earnings per common share – basic:
Income (loss) before cumulative effect of accounting change
Cumulative effect of accounting change
Earnings per common share – assuming dilution:
Income (loss) before cumulative effect of accounting change
Cumulative effect of accounting change
Cash dividends declared per common share
Other Financial Data ($ in thousands)
Cash flow from operations
Cash provided by (used in) operating activities
Operating cash flow
Balance Sheet Data (at end of period):
Total assets
Long-term debt, net of current maturities
Stockholders’ equity (deficit)
Operating Data ($ in thousands)
Oil reserves (mbbls)
Gas reserves (mmcf)
Reserves in equivalent thousand barrels
Reserves in equivalent million cubic feet
Future net revenues discounted at 10%
Future net revenues undiscounted
Oil price used in reserve report (per bbl)
Gas price used in reserve report (per mcf)
Oil production (mbbls)
Gas production (mmcf)
Production in equivalent thousand barrels
Production in equivalent million cubic feet
Average oil sales price (per bbl) 1
Average gas sales price (per mcf) 1
Average gas equivalent sales price (per mcfe) 1
2003 2002 2001 2000
$ 1,296,822 $ 568,187 $ 820,318 $ 470,170
420,610 170,315 148,733 157,782
–– – –
1,717,432 738,502 969,051 627,952
137,583 98,191 75,374 50,085
77,893 30,101 33,010 24,840
23,753 17,618 14,449 13,177
6,402 – – –
410,288 165,736 144,373 152,309
369,465 221,189 172,902 101,291
16,793 14,009 8,663 7,481
–– – –
–– – –
–– – –
1,042,177 546,844 448,771 349,183
675,255 191,658 520,280 278,769
2,827 7,340 2,877 3,649
(154,356) (112,031) (98,321) (86,256)
(22,774) (19,827) (63,138) –
(174,303) (124,518) (158,582) (82,607)
500,952 67,140 361,698 196,162
5,000 (1,822) 3,565 –
185,360 28,676 140,727 (259,408)
310,592 40,286 217,406 455,570
2,389 – – –
312,981 40,286 217,406 455,570
(22,469) (10,117) (2,050) (8,484)
–– – 6,574
$ 290,512 $ 30,169 $ 215,356 $ 453,660
$ 1.36 $ 0.18 $ 1.33 $ 3.52
0.02 – – –
$ 1.38 $ 0.18 $ 1.33 $ 3.52
$ 1.20 $ 0.17 $ 1.25 $ 3.01
0.01 – – –
$ 1.21 $ 0.17 $ 1.25 $ 3.01
$ 0.135 $ 0.06 – –
$ 945,602 $ 432,531 $ 553,737 $ 314,640
903,929 412,517 518,563 305,804
$ 4,572,291 $ 2,875,608 $ 2,286,768 $ 1,440,426
2,057,713 1,651,198 1,329,453 944,845
1,732,810 907,875 767,407 313,232
51,422 37,587 30,093 23,797
2,860,040 1,979,601 1,599,386 1,212,033
528,095 367,521 296,658 225,802
3,168,575 2,205,125 1,779,946 1,354,813
$ 7,333,142 $ 3,717,645 $ 1,646,667 $ 6,046,028
13,074,018 $ 6,758,869 $ 2,966,032 $ 10,702,974
$ 30.22 $ 30.18 $ 18.82 $ 26.41
$ 5.68 $ 4.28 $ 2.51 $ 10.12
4,665 3,466 2,880 3,068
240,366 160,682 144,171 115,771
44,726 30,246 26,909 22,363
268,356 181,478 161,451 134,179
$ 25.85 $ 25.22 $ 26.92 $ 26.39
$ 4.85 $ 3.54 $ 4.56 $ 3.36
$ 4.79 $ 3.61 $ 4.56 $ 3.50
1Excludes unrealized gains (losses) on oil and gas hedging.
$
Selected Financial Data
Years ended December 31,dd