Chesapeake Energy 2003 Annual Report Download - page 11
Download and view the complete annual report
Please find page 11 of the 2003 Chesapeake Energy annual report below. You can navigate through the pages in the report by either clicking on the pages listed below, or by using the keyword search tool below to find specific information within the annual report.-
 1
1 -
 2
2 -
 3
3 -
 4
4 -
 5
5 -
 6
6 -
 7
7 -
 8
8 -
 9
9 -
 10
10 -
 11
11 -
 12
12 -
 13
13 -
 14
14 -
 15
15 -
 16
16
 |
 |

Chesapeake Energy Corporation Annual Report 2003
7
company’s debt to total capitalization and to achieve an investment grade rating for our unsecured debt in the years ahead.
During 2003, Chesapeake’s secured debt facility earned an investment grade rating and we are confident the strength
of our assets and business strategy will provide further significant balance sheet improvement and strong shareholder value
performance
in the years ahead.
Eleven Years of Industry-Leading
Performance
We hope the foregoing review of our business strategy helps
explain how Chesapeake has been able to create industry-leading
performance
for our shareholders during our first 11
years as a public company. Please find below various operational and financial achievements that we believe highlight just
how much progress we have made as a company during the past 11 years:
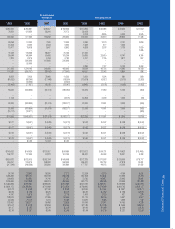
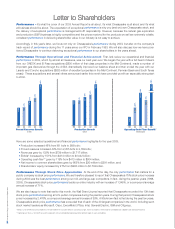
•Production has increased from 4 bcfe to 268 bcfe, a compound annual growth rate (CAGR) of 48%;
•Proved reserves have increased from 137 bcfe to 3,169 bcfe, a CAGR of 35%;
•Revenues have grown from $17 million to $1.717 billion, a CAGR of 55%;
•Ebitda* has increased from $7 million to $1.042 billion, a CAGR of 62%;
•Operating cash flow** has grown from $4 million to $904 million, a CAGR of 66%;
•Net income available to common shareholders has grown from a first year loss to $291 million;
•Shareholders’ equity has increased from $31 million to $1.733 billion, a CAGR of 46% and;
•Chesapeake’s stock price has grown from a split-adjusted IPO price of $1.33 per share to a year-end 2003 price of
$13.58 per share, a CAGR of 24%.
We are proud of the company’s track record of
performance
during the past 11 years and believe we can continue
building on it during 2004.
Looking Forward As we conclude this letter and reflect on our
performance
during Chesapeake’s first 11 years, we
remain optimistic about the continued success of the company and our ability to deliver value to our shareholders. We have
built a strong foundation based on the commitment of 1,300 top-notch employees, a time-tested and successful business
strategy, a value-added risk-management program, a steadily improving balance sheet and increasingly valuable natural
gas assets. We also offer an entrepreneurial and experienced management team that has proven itself through a full range
of commodity cycle challenges in building a $6.4 billion enterprise from an initial $50,000 investment in just 15 years.
We are off to a great start in delivering another successful year of
performance
to our shareholders in 2004. In the first three
months of the year, we have already negotiated $600 million of acquisitions, drilled 120 new operated wells, established new
daily production records and increased our production and earnings forecasts for the year.
In addition, natural gas prices continue to strengthen because of increasing U.S. gas demand and decreasing U.S. gas sup-
ply. As a result, we believe the stage is set for an extended period of strong natural gas prices. Just as the 1990’s with its
low gas prices was a decade that mostly benefited natural gas consumers, this decade with its high gas prices will
primarily benefit natural gas producers and their shareholders. In this environment, we believe Chesapeake can continue
leading the way in delivering exceptional shareholder value
performance
in 2004 and beyond.
Best regards,
Aubrey K. McClendon
Chairman and Chief Executive Officer
Tom L. Ward
President and Chief Operating Officer
March 31, 2004
* Ebitda is a non-GAAP measure that represents net income before the cumulative effect of accounting changes, income tax expense, interest expense and depreciation, depletion and amortization expense.
** Operating cash flow is a non-GAAP measure that represents net cash provided by operating activities before changes in assets and liabilities.