Chesapeake Energy 1996 Annual Report Download - page 2
Download and view the complete annual report
Please find page 2 of the 1996 Chesapeake Energy annual report below. You can navigate through the pages in the report by either clicking on the pages listed below, or by using the keyword search tool below to find specific information within the annual report.-
 1
1 -
 2
2 -
 3
3 -
 4
4 -
 5
5 -
 6
6 -
 7
7 -
 8
8 -
 9
9 -
 10
10 -
 11
11 -
 12
12 -
 13
13 -
14
-
15
-
16
-
17
-
18
-
19
-
20
-
21
-
22
-
23
-
24
-
25
-
26
-
27
-
28
-
29
-
30
-
31
-
32
-
33
-
34
-
35
-
36
-
37
-
38
-
39
-
40
-
41
-
42
-
43
-
44
-
45
-
46
-
47
-
48
-
49
-
50
-
51
-
52
-
53
-
54
-
55
-
56
-
57
-
58
-
59
-
60
-
61
-
62
-
63
-
64
-
65
-
66
-
67
-
68
-
69
 |
 |

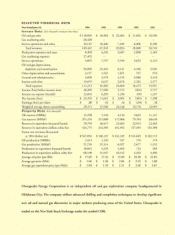
SELECTED FINANCIAL DATA
Chesapeake Energy Corporation is an independent oii and gas exploration company headquartered in
Oklahoma City. The company utilizes advanced drilling and completion techniques to develop significant
new oil and natural gas discoveries in major onshore producing areas of the United States. Chesapeake is
traded on the New York Stock Exchange under the symbol CHK.
Year Ended June 30, 1996 1995 1994 1993 1992
I n come Data in thousands, except per share data)
Oil and gas sales $110,849 $56,983 $22,404 $11,602 $10,520
Gas marketing sales 28,428
Service operations and other 10,145 10,360 7,420 6,406 8,198
Total revenues 149,422 67,343 29,824 18,008 18,718
Production expenses and taxes 8,303 4,256 3,647 2,890 2,103
Gas marketing expenses 27,452
Service operations 4,895 7,747 5,199 3,653 4,113
Oil and gas depreciation,
depletion and amortization 50,899 25,410 8,141 4,184 2,910
Other depreciation and amortization 3,157 1,765 1,871 557 974
General and administrative 4,828 3,578 3,135 4,906 3,314
Interest and other 13,679 6,627 2,676 2,282 2,577
Total expenses 113,213 49,383 24,669 18,472 15,991
Income (loss) before income taxes 36,209 17,960 5,155 (464) 2,727
Income tax expense (benefit) 12,854 6,299 1,250 (99) 1,337
Net income (loss) $23,355 $11,661 $3,905 $(365) $1,390
Earnings (loss) per share $.80 $.42 $.16 $(.04) $.10
Weighted average shares outstanding 29,171 27,936 24,120 16,776 13,955
Property Data ($in thousands)
Oil reserves (MBhls) 12,258 5,116 4,154 9,622 11,147
Gas reserves (MMcf) 351,224 211,808 117,066 79,763 68,618
Reserves in equivalent thousand barrels 70,795 40,417 23,665 22,915 22,583
Reserves in equivalent million cubic feet 424,775 242,505 141,992 137,495 135,500
Future net revenues discounted
at 10% (before tax) $ 547,016 $188,137 $141,249 $141,665 $162,713
Oil production (MBbls) 1,413 1,139 537 276 374
Gas production (MMcf) 51,710 25,114 6,927 2,677 1,252
Production in equivalent thousand barrels 10,031 5,325 1,692 722 583
Production in equivalent million cubic feet 60,190 31,947 10,152 4,333 3,496
Average oil price (per Bbl) $17.85 $17.36 $15.09 $20.20 $21.85
Average gas price (Mcf) $1.66 $1.48 $2.06 $2.25 $1.88
Average gas equivalent price (per Mcfe) $1.84 $1.78 $2.21 $2.68 $3.01