Charles Schwab 2013 Annual Report Download - page 8
Download and view the complete annual report
Please find page 8 of the 2013 Charles Schwab annual report below. You can navigate through the pages in the report by either clicking on the pages listed below, or by using the keyword search tool below to find specific information within the annual report.-
 1
1 -
 2
2 -
 3
3 -
 4
4 -
 5
5 -
 6
6 -
 7
7 -
 8
8 -
 9
9 -
 10
10 -
 11
11 -
 12
12 -
 13
13 -
 14
14 -
 15
15 -
 16
16 -
 17
17 -
 18
18 -
 19
19 -
20
-
21
-
22
-
23
-
24
-
25
-
26
-
27
-
28
-
29
-
30
-
31
-
32
-
33
-
34
-
35
-
36
-
37
-
38
-
39
-
40
-
41
-
42
-
43
-
44
-
45
-
46
-
47
-
48
-
49
-
50
-
51
-
52
-
53
-
54
-
55
-
56
-
57
-
58
-
59
-
60
-
61
-
62
-
63
-
64
-
65
-
66
-
67
-
68
-
69
-
70
-
71
-
72
-
73
-
74
-
75
-
76
-
77
-
78
-
79
-
80
-
81
-
82
-
83
-
84
-
85
-
86
-
87
-
88
-
89
-
90
-
91
-
92
-
93
-
94
-
95
-
96
-
97
-
98
-
99
-
100
-
101
-
102
-
103
-
104
-
105
-
106
-
107
-
108
-
109
-
110
-
111
-
112
-
113
-
114
-
115
-
116
-
117
-
118
-
119
-
120
-
121
-
122
-
123
-
124
-
125
-
126
-
127
-
128
-
129
-
130
-
131
-
132
-
133
-
134
 |
 |

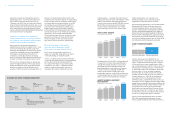
12 FINANCIAL HIGHLIGHTS GROWTH IN CLIENT ASSETS AND ACCOUNTS 13
(In Billions, at Year End, Except as Noted) 2009-13 2012-13 2013 2012 2011 2010 2009
Assets in client accounts
Schwab One®
, other cash equivalents
and deposits from banking clients 18% 7% $ 127.3 $ 119.0 $ 96.4 $ 81.1 $ 65.1
Proprietary funds (Schwab Funds®
and Laudus Funds®
):
Money market funds (1%) — 167.7 167.9 159.8 154.5 171.2
Equity and bond funds 14% 44% 71.2 49.6 38.2 46.0 41.6
Total proprietary funds 3% 10% 238.9 217.5 198.0 200.5 212.8
Mutual Fund Marketplace® (1):
Mutual Fund OneSource® (2) 10% 17% 260.5 223.2 198.6 208.6 175.0
Mutual fund clearing services 16% (7%) 147.4 159.1 104.2 42.1 81.8
Other third-party mutual funds 13% 12% 404.1 360.1 305.9 291.8 243.8
Total Mutual Fund Marketplace 13% 9% 812.0 742.4 608.7 542.5 500.6
Total mutual fund assets 10% 9% 1,050.9 959.9 806.7 743.0 713.4
Equity and other securities(1) 17% 29% 906.3 702.4 607.9 589.4 485.0
Fixed income securities 2% (2%) 177.5 181.8 176.9 171.3 167.0
Margin loans outstanding 12% 10% (12.6) (11.5) (10.2) (10.3) (7.9)
Total client assets 12% 15% $ 2,249.4 $ 1,951.6 $ 1,677.7 $ 1,574.5 $ 1,422.6
Client assets by business(3)
Investor Services 13% 12% $ 1,241.5 $ 1,112.1 $ 955.3 $ 825.1 $ 752.8
Advisor Services 11% 20% 1,007.9 839.5 722.4 749.4 669.8
Total client assets 12% 15% $ 2,249.4 $ 1,951.6 $ 1,677.7 $ 1,574.5 $ 1,422.6
Net growth in assets in client accounts
(for the year ended)
Net new assets by business(3)
Investor Services (4, 5) N/M N/M $ (18.2) $ 79.7 $ 97.4 $ (25.6) $ 40.3
Advisor Services (6) 6% — 59.8 60.0 48.5 52.2 47.0
Total net new assets (17%) (70%) $ 41.6 $ 139.7 $ 145.9 $ 26.6 $ 87.3
Net market gains (losses) 7% 91% 256.2 134.2 (42.7) 125.3 198.3
Net growth 1% 9% $ 297.8 $ 273.9 $ 103.2 $ 151.9 $ 285.6
New brokerage accounts (7)
(in thousands, for the year ended) 5% 7% 960 900 1,138 829 787
Clients (in thousands)
Active Brokerage Accounts(8) 4% 3% 9,093 8,787 8,552 7,998 7,701
Banking Accounts(9) 13% 6% 916 865 780 690 567
Corporate Retirement
Plan Participants (4) (3%) (17%) 1,305 1,571 1,492 1,477 1,465
GROWTH RATES
ANNUAL
1YEAR
COMPOUNDED
4YEAR
(2)
GROWTH IN CLIENT ASSETS AND ACCOUNTS
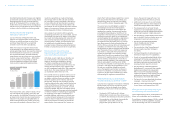
(In Millions, Except Per Share Amounts and as Noted) 2012-13 2013 2012 2011
Net revenues 11% $ 5,435 $ 4,883 $ 4,691
Expenses excluding interest 9% $ 3,730 $ 3,433 $ 3,299
Net income available to common stockholders 14% $ 1,010 $ 883 $ 864
Basic earnings per common share 13% $ .78 $ .69 $ .70
Diluted earnings per common share 13% $ .78 $ .69 $ .70
Dividends declared per common share — $ .24 $ .24 $ .24
Weighted-average common shares
outstanding — diluted 1% 1,293 1,275 1,229
Closing market price per share (at year end) 81% $ 26.00 $ 14.36 $ 11.26
Book value per common share (at year end) 7% $ 7.33 $ 6.83 $ 6.07
Net revenue growth 11% 4% 10%
Pre-tax prot margin 31.4% 29.7% 29.7%
Return on average common stockholders’ equity 11% 11% 12%
Full-time equivalent employees
(in thousands, at year end) — 13.8 13.8 14.1
Net revenues per average
full-time equivalent employee (in thousands) 10% $ 391 $ 354 $ 350
GROWTH RATE
1YEAR
FINANCIAL HIGHLIGHTS
(1) Excludes all proprietary money market, equity, and bond funds.
(2) Certain client assets at December 31, 2009, have been reclassied from Mutual Fund OneSource® to other third-party mutual funds.
(3) In 2013 , the Com pany rea lign ed it s rep or ta ble s egm ents a s a resul t of org aniz atio nal ch ange s. Th e se gmen t form erl y rep or ted as I nsti tuti onal S er vi ces was
renamed to Advisor Services. Additionally, the Retirement Plan Services and Corporate Brokerage Services business units are now part of the Investor
Services segment. Prior period segment information has been recast to reect these changes.
(4) In 2013, the Company reduced its reported totals for overall client assets and retirement plan participants by $24.7 billion and 317,000, respectively,
to reect the estimate d impact of the consolidation of its retirement plan recordkeeping plat forms and subsequent resignation from cer tain retirement
plan clients.
(5) 2013 incl udes ou to ws of $74. 5 bill ion rel ating to th e plann ed tra nsfer o f a mutua l fund cl earin g ser vices c lient an d $2.1 billio n from a nothe r mutual f und
clea ring s er vices c lient . 2013 also i nclu des in ows of $35.8 bi llion f rom ce rt ain mut ual fu nd cle aring s er vice s client s. 2012 in clud es ino ws of $33.1 b illio n
from cer tain mutual fund clearing ser vices clients. 2012 also includes out ows of approximately $100 million from the sale of Open E Cry, LLC, and $90 0
mill ion re latin g to a plan ned tr ans fer fr om Cor por ate Bro kerag e Ser vi ces. 2011 incl udes i nows o f $56.1 b illi on fro m a mutu al fun d clea ring s er vices c lient
and $7. 5 bil lion f rom t he acq uisit ion o f opti onsXp res s Hol ding s, In c. 2010 inc lude s out o ws of $51. 5 bi llio n rela ting to t he pl anne d de conver sio n of a mu tual
fun d clea ring s er vices c lient , and in ows of $50 0 milli on fro m the ac quisit ion of W indh aven Inves tmen t Mana geme nt, In c., a nd $1.2 bil lion f rom a mu tual
fund clearing services client.
(6) 2012 includes inows of approximately $900 million from the acquisition of ThomasPartners, Inc., and outows of $1.2 billion from the closure of
brokersXpress LLC. 2010 includes inows of $1.5 billion from the acquisition of Windhaven Investment Management, Inc.
(7) 2011 includes 315,000 new brokerage accounts from the acquisition of optionsXpress Holdings, Inc.
(8) In 2012, th e Compa ny remo ved ap prox imate ly 30, 00 0 bro kera ge acco unts d ue to es cheat ment a nd oth er fa ct ors a nd re duce d accoun ts by 19,0 00 f rom th e
sale of Open E Cry, LLC, and the closure of brokersXpress LLC.
(9) Eective 2010, the number of banking accounts excludes credit cards. 2009 has been recast to reect this change.
N/M — Not Meaningful