CenterPoint Energy 2009 Annual Report Download - page 4
Download and view the complete annual report
Please find page 4 of the 2009 CenterPoint Energy annual report below. You can navigate through the pages in the report by either clicking on the pages listed below, or by using the keyword search tool below to find specific information within the annual report.-
 1
1 -
 2
2 -
 3
3 -
 4
4 -
 5
5 -
 6
6 -
 7
7 -
 8
8 -
 9
9 -
 10
10 -
 11
11 -
 12
12 -
 13
13 -
 14
14 -
 15
15 -
16
-
17
-
18
-
19
-
20
-
21
-
22
-
23
-
24
-
25
-
26
-
27
-
28
-
29
-
30
-
31
-
32
-
33
-
34
-
35
-
36
-
37
-
38
-
39
-
40
-
41
-
42
-
43
-
44
-
45
-
46
-
47
-
48
-
49
-
50
-
51
-
52
-
53
-
54
-
55
-
56
-
57
-
58
-
59
-
60
-
61
-
62
-
63
-
64
-
65
-
66
-
67
-
68
-
69
-
70
-
71
-
72
-
73
-
74
-
75
-
76
-
77
-
78
-
79
-
80
-
81
-
82
-
83
-
84
-
85
-
86
-
87
-
88
-
89
-
90
-
91
-
92
-
93
-
94
-
95
-
96
-
97
-
98
-
99
-
100
-
101
-
102
-
103
-
104
-
105
-
106
-
107
-
108
-
109
-
110
-
111
-
112
-
113
-
114
-
115
-
116
-
117
-
118
-
119
-
120
-
121
-
122
-
123
-
124
-
125
-
126
-
127
-
128
-
129
-
130
-
131
-
132
-
133
-
134
-
135
-
136
-
137
-
138
-
139
-
140
-
141
-
142
-
143
-
144
-
145
-
146
-
147
-
148
-
149
-
150
 |
 |

2
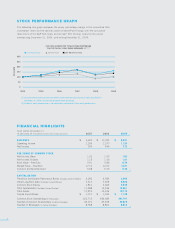
S TOCK PE RFO RM AN CE GR APH
The following line graph compares the yearly percentage change in the cumulative total
shareholder return on the common stock of CenterPoint Energy with the cumulative
total return of the S&P 500 Index and the S&P 500 Utilities Index for the period
commencing December 31, 2004, and ending December 31, 2009.
(1) Assumes that the value of the investment in the common stock and each index was $100 on
December 31, 2004, and that all dividends were reinvested.
(2) Historical stock performance is not necessarily indicative of future stock performance.
0
50
100
150
200
250
300
2004 2005 2006 2007 2008 2009
CenterPoint Energy S&P 500 Index S&P 500 Utilities Index
DOLLARS
FIVE-YEAR CUMULATIVE TOTAL RETURN COMPARISON
FOR THE FISCAL YEARS ENDED DECEMBER 31 (1) (2)
FI NA NCI AL H IG HLI GHT S
YEAR ENDED DECEMBER 31
IN MILLIONS OF DOLLARS (EXCEPT PER SHARE AMOUNTS) 2007 2008 2009
REVEN UES $ 9,623 $ 11,322 $ 8,281
Operating Income 1,185 1,273 1,124
Net Income 395 446 372
PER S HARE OF COMM ON STOC K
Net Income, Basic 1.23 1.32 1.02
Net Income, Diluted 1.15 1.30 1.01
Book Value – Year End 5.61 5.84 6.74
Market Value – Year End 17.13 12.62 14.51
Common Dividend Declared 0.68 0.73 0.76
CAPIT ALIZA TI ON
Transition and System Restoration Bonds (Includes Current Portion) 2,260 2,589 3,046
Other Long-Term Debt (Includes Current Portion) 7,417 7,925 6,976
Common Stock Equity 1,811 2,022 2,639
Total Capitalization (Includes Current Portion) 11,488 12,536 12,661
Total Assets 17,872 19,676 19,773
Capital Expenditures $ 1,011 $ 1,053 $ 1,148
Common Stock Outstanding (In Thousands) 322,719 346,089 391,747
Number of Common Shareholders (In Actual Numbers) 49,271 47,405 45,879
Number of Employees (In Actual Numbers) 8,568 8,801 8,810