CenterPoint Energy 2004 Annual Report Download - page 5
Download and view the complete annual report
Please find page 5 of the 2004 CenterPoint Energy annual report below. You can navigate through the pages in the report by either clicking on the pages listed below, or by using the keyword search tool below to find specific information within the annual report.-
 1
1 -
 2
2 -
 3
3 -
 4
4 -
 5
5 -
 6
6 -
 7
7 -
 8
8 -
 9
9 -
 10
10 -
 11
11 -
 12
12 -
 13
13 -
 14
14 -
 15
15 -
 16
16 -
17
-
18
-
19
-
20
-
21
-
22
-
23
-
24
-
25
-
26
-
27
-
28
-
29
-
30
-
31
-
32
-
33
-
34
-
35
-
36
-
37
-
38
-
39
-
40
-
41
-
42
-
43
-
44
 |
 |

3
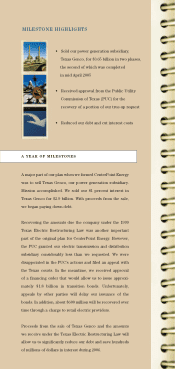
FINANCIAL HIGHLIGHTS
Year Ended December 31
2002 2003 2004
(In Millions Of Dollars Except Per Share Amounts)
Revenues $ 6,438 $ 7,790 $ 8,510
Operating Income $ 1,440 $ 1,355 $ 864
Income From Continuing Operations(1) $ 482 $ 409 $ 205
Per Share of Common Stock:
Income From Continuing Operations, Basic(1) $ 1.62 $ 1.35 $ 0.67
Income From Continuing Operations, Diluted(1) $ 1.61 $ 1.24 $ 0.61
Book Value – Year End $ 4.74 $ 5.77 $ 3.59
Market Price – Year End $ 8.01 $ 9.69 $ 11.30
Common Dividend Paid $ 1.07 $ 0.40 $ 0.40
Capitalization:
Long-term Debt (Includes Current Maturities) $ 9,996 $ 10,939 $ 9,029
Trust Preferred Securities(2) $ 706 $ — $ —
Common Stock Equity $ 1,422 $ 1,761 $ 1,106
Total Capitalization (Includes Current Maturities) $ 12,124 $ 12,700 $ 10,135
Total Assets(3) $ 16,041 $ 17,217 $ 16,597
Capital Expenditures(3) $ 566 $ 497 $ 530
Common Stock Outstanding(4) (in thousands) 300,102 305,385 308,045
Number of Common Shareholders 67,308 63,660 59,448
Number of Employees 12,019 11,046 9,093
1. Before extraordinary loss.
2. See footnote (4) on page 34.
3. Excluding discontinued operations. See page 34.
4. Excludes ESOP shares of 4,915,577 and 911,847 at December 31, 2002, and 2003, respectively.
OVER 130 YEARS
OF RELIABLE SERVICE