Cathay Pacific 2003 Annual Report Download - page 19
Download and view the complete annual report
Please find page 19 of the 2003 Cathay Pacific annual report below. You can navigate through the pages in the report by either clicking on the pages listed below, or by using the keyword search tool below to find specific information within the annual report.-
 1
1 -
2
-
3
-
4
-
5
-
6
-
7
-
8
-
 9
9 -
 10
10 -
 11
11 -
 12
12 -
 13
13 -
 14
14 -
 15
15 -
 16
16 -
 17
17 -
 18
18 -
 19
19 -
 20
20 -
 21
21 -
 22
22 -
 23
23 -
 24
24 -
 25
25 -
 26
26 -
 27
27 -
 28
28 -
 29
29 -
30
-
31
-
32
-
33
-
34
-
35
-
36
-
37
-
38
-
39
-
40
-
41
-
42
-
43
-
44
-
45
-
46
-
47
-
48
-
49
-
50
-
51
-
52
-
53
-
54
-
55
-
56
-
57
-
58
-
59
-
60
-
61
-
62
-
63
-
64
-
65
-
66
-
67
-
68
-
69
-
70
-
71
-
72
-
73
-
74
-
75
-
76
 |
 |

Cathay Pacific Airways Limited Annual Report 2003 17
Financial Review
Cathay Pacific:
total operating expenses
28%
Staff
1%
Commissions
19%
Fuel
15%
Landing,
parking and
route
expenses
5%
Inflight
service and
passenger
expenses
11%
Aircraft
maintenance
17%
Depreciation
and operating
leases
2%
Net finance
charges
2%
Others
Cathay Pacific:
fuel price and consumption
US cents per
American gallon
American gallon
in million
20
40
60
80
100
0302010099
700
750
800
850
900
Into wing price – before hedging
Into wing price – after hedging
Uplifted volume
Operating expenses
Group Cathay Pacific
2003 2002 2003 2002
HK$M HK$M Change HK$M HK$M Change
Staff 8,035 7,918 +1.5% 7,318 7, 1 3 0 +2.6%
Inflight service and passenger expenses 1,223 1,464 -16.5% 1,223 1,464 -16.5%
Landing, parking and route expenses 4,193 4,649 -9.8% 4,106 4,468 -8.1%
Fuel 5,236 4,895 +7.0% 5,164 4,735 +9.1%
Aircraft maintenance 2,856 3,312 -13.8% 2,853 3,194 -10.7%
Aircraft depreciation and operating leases 3,988 3,711 +7.5% 3,931 3,624 +8.5%
Other depreciation and operating leases 872 1,009 -13.6% 649 765 -15.2%
Commissions 400 501 -20.2% 398 498 -20.1%
Exchange gain (244) (179) +36.3% (247) (169) +46.2%
Others 794 1,060 -25.1% 721 913 -21.0%
Operating expenses 27,353 28,340 -3.5% 26,116 26,622 -1.9%
Net finance charges 620 74 3 -16.6% 606 723 -16.2%
To tal operating expenses 27,973 29,083 -3.8% 26,722 27,345 -2.3%
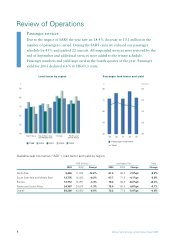
•Staff costs increased due to an increase in
average staff numbers.
•Inflight service and passenger expenses
decreased due to a reduction in passenger
numbers and cost control initiatives.
•Landing, parking and route expenses fell as a
result of flight cancellations.
•Fuel costs increased mainly due to the 18.5%
increase in the average fuel price.
•Aircraft maintenance decreased as a result of
flight cancellations and the temporary parking
of aircraft.
•Aircraft depreciation and operating leases
increased due to the new aircraft deliveries.