Carnival Cruises 2015 Annual Report Download - page 9
Download and view the complete annual report
Please find page 9 of the 2015 Carnival Cruises annual report below. You can navigate through the pages in the report by either clicking on the pages listed below, or by using the keyword search tool below to find specific information within the annual report.-
 1
1 -
 2
2 -
 3
3 -
 4
4 -
 5
5 -
 6
6 -
 7
7 -
 8
8 -
 9
9 -
 10
10 -
 11
11 -
 12
12 -
 13
13 -
 14
14 -
 15
15 -
 16
16 -
 17
17 -
 18
18 -
 19
19 -
 20
20 -
21
-
22
-
23
-
24
-
25
-
26
-
27
-
28
-
29
-
30
-
31
-
32
-
33
-
34
-
35
-
36
-
37
-
38
-
39
-
40
-
41
-
42
-
43
-
44
-
45
-
46
-
47
-
48
-
49
-
50
-
51
-
52
-
53
-
54
-
55
-
56
-
57
-
58
-
59
-
60
-
61
-
62
-
63
-
64
-
65
-
66
-
67
-
68
-
69
-
70
-
71
-
72
-
73
-
74
-
75
-
76
-
77
-
78
-
79
-
80
-
81
-
82
-
83
-
84
-
85
-
86
-
87
-
88
 |
 |

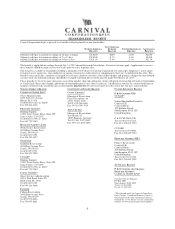
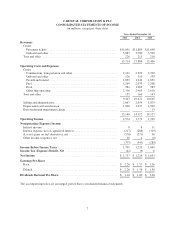
CARNIVAL CORPORATION & PLC
CONSOLIDATED STATEMENTS OF INCOME
(in millions, except per share data)
Years Ended November 30,
2015 2014 2013
Revenues
Cruise
Passenger tickets ............................................... $11,601 $11,889 $11,648
Onboard and other .............................................. 3,887 3,780 3,598
Tour and other ................................................... 226 215 210
15,714 15,884 15,456
Operating Costs and Expenses
Cruise
Commissions, transportation and other .............................. 2,161 2,299 2,303
Onboard and other .............................................. 526 519 539
Payroll and related .............................................. 1,859 1,942 1,859
Fuel .......................................................... 1,249 2,033 2,208
Food ......................................................... 981 1,005 983
Other ship operating ............................................. 2,516 2,463 2,610
Tour and other ................................................... 155 160 143
9,447 10,421 10,645
Selling and administrative .......................................... 2,067 2,054 1,879
Depreciation and amortization ....................................... 1,626 1,637 1,590
Ibero trademark impairment charge ................................... - - 13
13,140 14,112 14,127
Operating Income .................................................. 2,574 1,772 1,329
Nonoperating (Expense) Income
Interest income ................................................... 8 8 11
Interest expense, net of capitalized interest ............................. (217) (288) (319)
(Losses) gains on fuel derivatives, net ................................. (576) (271) 36
Other income (expense), net ......................................... 10 4 (8)
(775) (547) (280)
Income Before Income Taxes ........................................ 1,799 1,225 1,049
Income Tax (Expense) Benefit, Net ................................... (42) (9) 6
Net Income ....................................................... $ 1,757 $ 1,216 $ 1,055
Earnings Per Share
Basic ........................................................... $ 2.26 $ 1.57 $ 1.36
Diluted ......................................................... $ 2.26 $ 1.56 $ 1.36
Dividends Declared Per Share ....................................... $ 1.10 $ 1.00 $ 1.00
The accompanying notes are an integral part of these consolidated financial statements.
7