Carnival Cruises 2015 Annual Report Download
Download and view the complete annual report
Please find the complete 2015 Carnival Cruises annual report below. You can navigate through the pages in the report by either clicking on the pages listed below, or by using the keyword search tool below to find specific information within the annual report.-
 1
1 -
 2
2 -
 3
3 -
 4
4 -
 5
5 -
 6
6 -
 7
7 -
 8
8 -
 9
9 -
 10
10 -
 11
11 -
 12
12 -
13
-
14
-
15
-
16
-
17
-
18
-
19
-
20
-
21
-
22
-
23
-
24
-
25
-
26
-
27
-
28
-
29
-
30
-
31
-
32
-
33
-
34
-
35
-
36
-
37
-
38
-
39
-
40
-
41
-
42
-
43
-
44
-
45
-
46
-
47
-
48
-
49
-
50
-
51
-
52
-
53
-
54
-
55
-
56
-
57
-
58
-
59
-
60
-
61
-
62
-
63
-
64
-
65
-
66
-
67
-
68
-
69
-
70
-
71
-
72
-
73
-
74
-
75
-
76
-
77
-
78
-
79
-
80
-
81
-
82
-
83
-
84
-
85
-
86
-
87
-
88
 |
 |

2015 ANNUAL REPORT
Table of contents
-
Page 1
2015 ANNUAL REPORT -
Page 2
... CERTIFIED PUBLIC ACCOUNTING FIRM ...MANAGEMENT'S DISCUSSION AND ANALYSIS OF FINANCIAL CONDITION AND RESULTS OF OPERATIONS ...SELECTED FINANCIAL DATA ...MARKET PRICE FOR COMMON STOCK AND ORDINARY SHARES ...STOCK PERFORMANCE GRAPHS ...SELECTED QUARTERLY FINANCIAL DATA (UNAUDITED) ...CORPORATE AND... -
Page 3
...portfolio of cruise brands in North America, Europe, Australia and Asia are comprised of Carnival Cruise Line, Fathom, Holland America Line, Princess Cruises, Seabourn, AIDA Cruises, Costa Cruises, Cunard, P&O Cruises (Australia) and P&O Cruises (UK). Together, these brands operate 99 ships totaling... -
Page 4
... team members who create exceptional vacation experiences for nearly 11 million guests annually, along with the vital support of our travel agent partners around the globe. Their combined efforts enabled us to overcome a variety of obstacles in 2015 and to exceed the high-end of the full-year... -
Page 5
... included our multi-faceted campaign built around the 2015 Super Bowl, which generated more than 10 billion positive media impressions during the height of wave season; P&O Cruises' delivery of Britannia, the largest ship ever built specifically for British guests and named by Her Majesty the Queen... -
Page 6
... contributed to revenue yield improvements, and we have completed the design phase of a common revenue management system across a number of our brands. Significant progress was also made delivering cost savings in 2015 in a variety of procurement areas including air travel, food and hotel supplies... -
Page 7
... in the next two to three years. Thank you for your confidence and your shared vision of building upon the great legacy that is Carnival Corporation & plc as we continue to deliver the world's greatest holiday experiences. Arnold W. Donald President and Chief Executive Officer February 19, 2016 5 -
Page 8
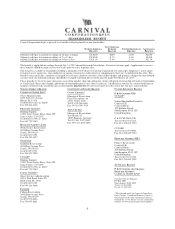
...below. NORTH AMERICA BRANDS CONTINENTAL EUROPE BRANDS UNITED KINGDOM BRANDS CARNIVAL CRUISE LINE* COSTA CRUISES* P & O CRUISES (UK) Guest Administration CUNARD* Manager of Reservation 3655 N.W. 87th Avenue Piazza Piccapietra, 48 Miami, FL 33178 16121 Genoa, Italy Senior Shareholder Executive Tel 800... -
Page 9
... per share data) Years Ended November 30, 2015 2014 2013 Revenues Cruise Passenger tickets ...Onboard and other ...Tour and other ...Operating Costs and Expenses Cruise Commissions, transportation and other ...Onboard and other ...Payroll and related ...Fuel ...Food ...Other ship operating ...Tour... -
Page 10
CARNIVAL CORPORATION & PLC CONSOLIDATED STATEMENTS OF COMPREHENSIVE INCOME (in millions) Years Ended November 30, 2015 2014 2013 Net Income ...Items Included in Other Comprehensive (Loss) Income Change in foreign currency translation adjustment ...Other ...Other Comprehensive (Loss) Income ...Total... -
Page 11
... 216 shares at 2015 and 2014 issued ...Additional paid-in capital ...Retained earnings ...Accumulated other comprehensive loss ...Treasury stock, 70 shares at 2015 and 59 shares at 2014 of Carnival Corporation and 27 shares at 2015 and 32 shares at 2014 of Carnival plc, at cost ...Total shareholders... -
Page 12
... expenses and other ...131 422 424 Accounts payable ...36 9 79 Accrued and other liabilities ...(31) (382) (333) Customer deposits ...354 92 (105) Net cash provided by operating activities ...INVESTING ACTIVITIES Additions to property and equipment ...Proceeds from sale of ships ...Payments of fuel... -
Page 13
CARNIVAL CORPORATION & PLC CONSOLIDATED STATEMENTS OF SHAREHOLDERS' EQUITY (in millions) Additional paid-in capital $8,252 10 Accumulated other comprehensive (loss) income $ (207) 368 Total shareholders' equity $23,888 1,055 368 (775) 1 Common stock Balances at November 30, 2012 ...Net income ...... -
Page 14
...Exchange ("NYSE") for Carnival Corporation and the London Stock Exchange for Carnival plc. In addition, Carnival plc American Depository Shares are traded on the NYSE (see Note 3). We are the largest leisure travel company in the world, and also the largest cruise company. We operate 99 cruise ships... -
Page 15
... of 2014 and 2013, $0.02 for 2012, $0.03 for pre-2010 and $0.11 in the aggregate. There was no annual diluted earnings per share impact for 2011 and 2010. This non-cash revision did not impact our operating cash flows for any period. The effects of this revision on the individual line items within... -
Page 16
... of original cost, as follows: Years Residual Values Ships ...Ship improvements ...Buildings and improvements ...Computer hardware and software ...Transportation equipment and other ...Leasehold improvements, including port facilities ... 30 Shorter of remaining ship life or useful life (3-28... -
Page 17
... impact of recognizing these shorter duration cruise revenues and costs and expenses on a completed voyage basis versus on a pro rata basis is not significant. Future travel discount vouchers issued to guests and ship charterers are included as a reduction of cruise passenger ticket revenues when 15 -
Page 18
...passenger ticket revenues and commissions, transportation and other costs were $524 million in 2015, $532 million in 2014 and $517 million in 2013. The remaining portion of fees, taxes and charges are also included in cruise passenger ticket revenues but are expensed in other ship operating expenses... -
Page 19
... Corporation common stock and Carnival plc ordinary shares are considered a single class of shares since they have equivalent rights (see Note 3). Accounting Pronouncements In 2014, amended guidance was issued by the Financial Accounting Standards Board ("FASB") regarding the accounting for Service... -
Page 20
... plc's DLC arrangement. The contracts governing the DLC arrangement provide that Carnival Corporation and Carnival plc each continue to have separate boards of directors, but the boards and senior executive management of both companies are identical. The constitutional documents of each of the... -
Page 21
... in 2013. Repairs and maintenance expenses, including minor improvement costs and dry-dock expenses, were $1.0 billion in 2015, $936 million in 2014 and $974 million in 2013, and are substantially all included in other ship operating expenses. See Note 11 for a discussion regarding ship sales and... -
Page 22
...debt table does not include the impact of our foreign currency and interest rate swaps. At November 30, 2015, 50% and 50% (67% and 33% at November 30, 2014) of our debt was U.S. dollar and eurodenominated, respectively, including the effect of foreign currency swaps. At November 30, 2015, 60% and 40... -
Page 23
... are using the net proceeds for general corporate purposes. (g) The interest rate associated with our floating rate short-term borrowings represents an aggregate weightedaverage interest rate. At November 30, 2015, the scheduled annual maturities of our debt were as follows (in millions): 2016 2017... -
Page 24
At November 30, 2015, our committed ship financings are as follows: Fiscal Year Available for Funding Cruise Brands and Ships North America Carnival Cruise Line Carnival Vista (a) ...Newbuild (b) ...Holland America Line Koningsdam (a) ...Newbuild (b) ...Princess Majestic Princess (b) ...Seabourn ... -
Page 25
... in 2013. At November 30, 2015, minimum amounts payable for our operating leases, with initial or remaining terms in excess of one year, and for the annual usage of port facilities and other contractual commitments with remaining terms in excess of one year, were as follows (in millions): 2016 2017... -
Page 26
... hotel and transportation business of Holland America Princess Alaska Tours through U.S. corporations. Our North American cruise ship businesses and certain ship-owning subsidiaries are engaged in a trade or business within the U.S. Depending on its itinerary, any particular ship may generate income... -
Page 27
... total income of our companies doing business in Alaska and certain of their subsidiaries. UK and Australian Income Tax Cunard, P&O Cruises (UK) and P&O Cruises (Australia) are divisions of Carnival plc and have elected to enter the UK tonnage tax on a rolling 10-year term and, accordingly, reapply... -
Page 28
... costs and other ship operating expenses. NOTE 10 - Shareholders' Equity Carnival Corporation's Articles of Incorporation authorize its Board of Directors, at its discretion, to issue up to 40 million shares of preferred stock. At November 30, 2015 and 2014, no Carnival Corporation preferred stock... -
Page 29
... 14.7 million shares of Carnival Corporation common stock reserved for issuance under its employee benefit and dividend reinvestment plans. At November 30, 2015, there were 8.2 million ordinary shares of Carnival plc authorized for future issuance under its employee benefit plans. Accumulated other... -
Page 30
...The fair values of our Level 1 and Level 2 notes and other receivables were based on estimated future cash flows discounted at appropriate market interest rates. The fair values of our Level 3 notes receivable were estimated using risk-adjusted discount rates. (d) Debt does not include the impact of... -
Page 31
... initial trade prices. Subsequent valuations are based on observable inputs and other variables included in the valuation models such as interest rate, yield and commodity price curves, forward currency exchange rates, credit spreads, maturity dates, volatilities and netting arrangements. We use the... -
Page 32
... Celebration as of May 31, 2014 to determine if the ship was impaired. The principal assumptions used in our undiscounted cash flow analysis consisted of forecasted future operating results, including net revenue yields and net cruise costs including fuel prices, and the estimated residual value... -
Page 33
... cruise costs including fuel prices; capacity changes, including the expected rotation of vessels into, or out of, Holland America Line, P&O Cruises (Australia) and Princess; WACC of market participants, adjusted for the risk attributable to the geographic regions in which AIDA, Holland America Line... -
Page 34
... included estimating AIDA's, P&O Cruises (Australia)'s and Princess' trademarks fair value based upon a discounted future cash flow analysis, which estimated the amount of royalties that we are relieved from having to pay for use of the associated trademarks, based upon forecasted cruise revenues... -
Page 35
... of fixed rate debt to U.S. dollar LIBOR-based floating rate debt. These interest rate swaps settle through February 2016. (c) At November 30, 2015 and 2014, we had foreign currency derivatives consisting of foreign currency zero cost collars that are designated as foreign currency cash flow hedges... -
Page 36
... financial statements as of November 30, 2015 and 2014 and for the years ended November 30, 2015, 2014 and 2013 where such impacts were not significant. Fuel Price Risks Our exposure to market risk for changes in fuel prices substantially all relates to the consumption of fuel on our ships. We use... -
Page 37
... fuel derivatives consisted of zero cost collars on Brent as follows: Maturities (a) Transaction Dates Barrels (in thousands) Weighted-Average Floor Prices Weighted-Average Ceiling Prices Fiscal 2016 June 2012 ...February 2013 ...April 2013 ...Fiscal 2017 February 2013 ...April 2013 ...January 2014... -
Page 38
... and have used non-derivative financial instruments to manage foreign currency exchange rate risk for some of our ship construction payments. In January 2015, we entered into foreign currency zero cost collars that are designated as cash flow hedges for a portion of Majestic Princess' and Seabourn... -
Page 39
... on cruise sales in Australia and most of Europe where we are obligated to honor our guests' cruise payments made by them to their travel agents and tour operators regardless of whether we have received these payments. Concentrations of credit risk associated with these trade receivables, charter... -
Page 40
... includes Carnival Cruise Line, Holland America Line, Princess and Seabourn. Our EAA cruise segment includes AIDA, Costa, Cunard, P&O Cruises (Australia), P&O Cruises (UK) and prior to November 2014, Ibero. These individual cruise brand operating segments have been aggregated into two reportable... -
Page 41
... of our ships and ships under construction. Revenues by geographic areas, which are based on where our guests are sourced and not the cruise brands on which they sailed, were as follows (in millions): Years Ended November 30, 2015 2014 2013 North America ...Europe ...Australia and Asia ...Other... -
Page 42
...") and restricted stock units ("RSUs")), performance-based share ("PBS") awards, market-based share ("MBS") awards and stock options (collectively "equity awards"). Equity awards are principally granted to management level employees and members of our Boards of Directors. The plans are administered... -
Page 43
...weighted-average period of 0.9, 0.8 and 1.0 years, respectively. Stock Option Plans In 2007 and 2008, the Committee decided to cease granting stock options to our employees and non-executive board members, respectively, and to instead grant them TBS awards. A combined summary of Carnival Corporation... -
Page 44
... consolidated financial statements. Total expense for all defined benefit pension plans, including the multiemployer plans, was $47 million in 2015, $69 million in 2014 and $62 million in 2013. Defined Contribution Plans We have several defined contribution plans available to most of our employees... -
Page 45
..., except per share data): Years Ended November 30, 2015 2014 2013 Net income for basic and diluted earnings per share ...$1,757 $1,216 $1,055 Weighted-average common and ordinary shares outstanding ...Dilutive effect of equity plans ...Diluted weighted-average shares outstanding ...777 2 779... -
Page 46
... participation of our management, including our President and Chief Executive Officer and our Chief Financial Officer, we conducted an evaluation of the effectiveness of our internal control over financial reporting based on the 2013 Internal Control - Integrated Framework, issued by the Committee... -
Page 47
... the accounting principles used and significant estimates made by management, and evaluating the overall financial statement presentation. Our audit of internal control over financial reporting included obtaining an understanding of internal control over financial reporting, assessing the risk that... -
Page 48
... include those statements that may impact, among other things, the forecasting of our adjusted earnings per share; net revenue yields; booking levels; pricing; occupancy; operating, financing and tax costs, including fuel expenses; net cruise costs per available lower berth day; estimates of ship... -
Page 49
... for 2014 (diluted earnings per share was $2.26 in 2015 compared to $1.56 in 2014). The increase in our net income for 2015 was driven primarily by the following: - Increases in cruise ticket pricing, driven primarily by improvements in Alaskan and Caribbean itineraries for our North America brands... -
Page 50
...have been the largest attendance at a single day maritime event anywhere in the world. Finally, we had a five ship event in the Sydney Harbor for P&O Cruises (Australia) that attracted well over three hours of live coverage on Australia's "Today" show. Strong relationships with our travel agents are... -
Page 51
... In 2015, we introduced P&O Cruises (UK)'s 3,647-passenger Britannia, the largest ship ever built specifically for British guests and named by Her Majesty, Queen Elizabeth II. In addition, we signed eight new ship orders this year. As of January 22, 2016, we have a total of 17 cruise ships scheduled... -
Page 52
...% of our cruise costs and expenses in 2015, we have to estimate the useful life of each of our ships as well as their residual values. Secondly, we account for ship improvement costs by capitalizing those costs that we believe add value to our ships and have a useful life greater than one year, and... -
Page 53
... have increased by approximately $40 million assuming we had reduced our estimated 30-year ship useful life estimate by one year at the time we took delivery or acquired each of our ships. In addition, our 2015 ship depreciation expense would have increased by approximately $210 million assuming we... -
Page 54
... significant business. Our credit exposure also includes contingent obligations related to cash payments received directly by travel agents and tour operators for cash collected by them on cruise sales in Australia and most of Europe where we are obligated to honor our guests' cruise payments made... -
Page 55
... from our guests, and sales of goods and services primarily onboard our ships not included in the cruise ticket price including substantially all liquor and some non-alcoholic beverage sales, casino gaming, shore excursions, gift shop sales, photo sales, communication services, full service spas... -
Page 56
... 30, 2015 2014 2013 ALBDs (in thousands) (a)(b) ...Occupancy percentage (c) ...Passengers carried (in thousands) ...Fuel consumption in metric tons (in thousands) ...Fuel consumption in metric tons per ALBD ...Fuel cost per metric ton consumed ...Currencies U.S. dollar to Euro ...U.S. dollar to... -
Page 57
... partially offset by the 2015 foreign currency translational impact, which accounted for $165 million. Onboard and other revenues included concession revenues that decreased slightly and remained at $1.1 billion in both 2015 and 2014. North America Brands Cruise passenger ticket revenues made up 72... -
Page 58
... guests and $45 million - 4.1% capacity increase in ALBDs. Onboard and other revenues included concession revenues that decreased by $38 million, or 10%, to $329 million in 2015 from $367 million in 2014. This decrease was caused by the 2015 foreign currency translational impact. Costs and Expenses... -
Page 59
... Operating costs and expenses decreased by $517 million, or 8.2%, to $5.8 billion in 2015 from $6.3 billion in 2014. This decrease was caused by 503 million - lower fuel prices; $41 million - decreases in commissions, transportation and other related expenses; $25 million - lower fuel consumption... -
Page 60
... costs that are directly associated with onboard and other revenues and credit and debit card fees. Substantially all of our remaining cruise costs are largely fixed, except for the impact of changing prices and food expenses, once our ship capacity levels have been determined. Net passenger ticket... -
Page 61
...revision of 2014 and 2013 cruise ship operating expenses, our previously reported results changed as follows (in millions, except per ALBD data): Year Ended November 30, 2014 As Previously Reported As Revised Year Ended November 30, 2013 As Previously Reported As Revised Gross cruise costs per ALBD... -
Page 62
... impact is more significant to our 2015 results compared to 2014 and 2013 given the continuing expansion of our global business and the heightened volatility in foreign currency exchange rates. This differed from previous years when our constant dollar reporting removed substantially all of the... -
Page 63
...): Years Ended November 30, 2015 2014 Constant Constant Dollar 2014 Dollar 2015 2013 Passenger ticket revenues ...Onboard and other revenues ...Gross cruise revenues ...Less cruise costs Commissions, transportation and other ...Onboard and other ...Net passenger ticket revenues ...Net onboard and... -
Page 64
... Constant Dollar 2014 Dollar 2015 2013 Cruise operating expenses ...$ Cruise selling and administrative expenses ...Gross cruise costs ...Less cruise costs included above Commissions, transportation and other ...Onboard and other ...Restructuring expenses ...Gains (losses) on ship sales and ship... -
Page 65
..., except per share data): Years Ended November 30, 2015 2014 2013 Net income U.S. GAAP net income ...Restructuring expenses ...(Gains) losses on ship sales and ship impairments, net ...Ibero trademark and other impairment charges ...Unrealized losses (gains) on fuel derivatives, net ...Adjusted... -
Page 66
... number of dry-dock days and $88 million - higher selling, general and administrative expenses. Fuel costs decreased by $784 million, or 39%, to $1.2 billion in 2015 from $2.0 billion in 2014. This decrease was caused by: - - $776 million - lower fuel prices and $43 million - lower fuel consumption... -
Page 67
... by our guests. These increases were partially offset by a 1.0 percentage point decrease in occupancy, which accounted for $36 million. Onboard and other revenues included concession revenues of $1.1 billion in both 2014 and 2013. North America Brands Cruise passenger ticket revenues made up... -
Page 68
... to a decrease in air transportation costs related to guests who purchased their tickets from us; $87 million - lower fuel prices; $58 million - lower fuel consumption per ALBD; $56 million - nonrecurrence in 2014 of additional costs and expenses related to the 2013 voyage disruptions, net of third... -
Page 69
... nonrecurrence in 2014 of impairment charges related to Costa Classica and Costa Voyager; $51 million - lower fuel consumption per ALBD; $41 million - lower fuel prices; $39 million - lower dry-dock and other ship repair and maintenance expenses; $37 million - gain from the sale of Costa Voyager and... -
Page 70
...million - lower fuel prices and $107 million - lower fuel consumption per ALBD. These decreases were partially offset by our 2.7% capacity increase in ALBDs, which accounted for $59 million. Gross cruise costs decreased slightly by $65 million to $12.3 billion in 2014 from $12.4 billion in 2013 for... -
Page 71
..., our access to and cost of debt financing may be negatively impacted. At November 30, 2015, we had a working capital deficit of $4.5 billion. This deficit included $3.3 billion of current customer deposits, which represent the passenger revenues already collected for cruises departing over the next... -
Page 72
... publicly-traded notes, which net proceeds are being used for general corporate purposes; borrowed $697 million of long-term debt under an export credit facility and a bank loan; paid cash dividends of $816 million; purchased $533 million of shares of Carnival Corporation common stock in open market... -
Page 73
... dollars, are based on the November 30, 2015 exchange rates. As of November 30, 2015, our total annual capital expenditures consist of ships under contract for construction, including ship construction contracts entered into through January 22, 2016, estimated improvements to existing ships... -
Page 74
...or shares of Carnival Corporation common stock, as applicable. We use the Stock Swap programs in situations where we can obtain an economic benefit because either Carnival Corporation common stock or Carnival plc ordinary shares are trading at a price that is at a premium or discount to the price of... -
Page 75
.... At January 22, 2016, our remaining newbuild currency exchange rate risk relates to euro-denominated newbuild contract payments, which represent a total unhedged commitment of $2.0 billion and substantially relates to Carnival Cruise Line, Holland America Line, P&O Cruises (Australia) and Seabourn... -
Page 76
... 2015 guidances' forecasted average fuel price, we estimate that our 2016 fuel expense, excluding the effect of zero cost collar fuel derivatives, would change by $80 million. We mitigate a portion of our economic risk attributable to potential fuel price increases through the use of Brent zero cost... -
Page 77
...should be read in conjunction with those consolidated financial statements and the related notes. Years Ended November 30, 2015 2014 2013 2012 2011 (dollars in millions, except per share, per ton and currency data) Statements of Income Data Revenues ...Operating income ...Net income ...Earnings per... -
Page 78
... reported, to 27.3%. (c) Adjusted net income and adjusted fully diluted earnings per share was computed as follows: 2015 Years Ended November 30, 2014 2013 2012 2011 Net income U.S. GAAP net income ...$1,757 $1,216 $1,055 $1,285 $1,912 Restructuring expenses ...25 18 (Gains) losses on ship sales... -
Page 79
... Non-GAAP Financial Indicators" for further discussion of the (gains) losses on ship sales and ship impairments, net and goodwill, trademark and other impairment charges for the years ended November 30, 2015, 2014, and 2013. (ii). Represents impairment charges of $34 million for Costa Allegra and... -
Page 80
... of any future dividend is within the discretion of the Boards of Directors. Our dividends were and will be based on a number of factors, including our earnings, liquidity position, financial condition, tone of business, capital requirements, credit ratings and the availability and cost of obtaining... -
Page 81
...by taking the number of shares owned, assuming Carnival Corporation dividends are reinvested, multiplied by the market price of the shares. 5 -YEAR CUMULATIVE TOTAL RETURNS $200 $150 DOLLARS $100 $50 2010 2011 2012 2013 2014 2015 Carnival Corporation Common Stock FTSE 100 Index S&P 500 Index... -
Page 82
... invested in each of the indexes noted below. The Price Performance is calculated in the same manner as previously discussed. 5 -YEAR CUMULATIVE TOTAL RETURNS $200 $150 DOLLARS $100 $50 2010 2011 2012 2013 2014 2015 Carnival plc ADS FTSE 100 Index S&P 500 Index Dow Jones Recreational Index... -
Page 83
..., substantially all of Holland America Princess Alaska Tours' revenue and net income is generated from May through September in conjunction with the Alaska cruise season. Quarterly financial results for 2015 were as follows (in millions, except per share data): February 28 Quarters Ended May 31... -
Page 84
Quarterly financial results for 2014 were as follows (in millions, except per share data): February 28 Quarters Ended May 31 August 31 November 30 Revenues ...Operating income ...Net (loss) income ...(Loss) earnings per share Basic ...Diluted ...Adjusted net (loss) income (b) ...Adjusted earnings ... -
Page 85
...: Quarters Ended May 31 August 31 February 28 November 30 Net income U.S. GAAP net (loss) income ...Restructuring expenses ...(Gains) on ship sales and ship impairments, net ...Unrealized losses (gains) on fuel derivatives, net ...Adjusted net (loss) income ...Weighted-average shares outstanding... -
Page 86
-
Page 87
... Other Shareholder Information Copies of our joint Annual Report on Form 10-K, joint Quarterly Reports on Form 10-Q, joint Current Reports on Form 8-K, Carnival plc Annual Accounts and all amendments to those reports, press releases and other documents, as well as information on our cruise brands... -
Page 88
Carnival Place 3665 N.W. 87th Avenue Miami Florida 33178-2428 U.S.A. www.carnivalcorp.com Carnival House 100 Harbour Parade Southampton S015 1ST UK www.carnivalplc.com