Carnival Cruises 2007 Annual Report Download - page 4
Download and view the complete annual report
Please find page 4 of the 2007 Carnival Cruises annual report below. You can navigate through the pages in the report by either clicking on the pages listed below, or by using the keyword search tool below to find specific information within the annual report.-
 1
1 -
 2
2 -
 3
3 -
 4
4 -
 5
5 -
 6
6 -
 7
7 -
 8
8 -
 9
9 -
 10
10 -
 11
11 -
 12
12 -
 13
13 -
 14
14 -
 15
15 -
16
-
17
-
18
-
19
-
20
-
21
-
22
-
23
-
24
-
25
-
26
-
27
-
28
-
29
-
30
-
31
-
32
-
33
-
34
-
35
-
36
-
37
-
38
-
39
-
40
-
41
-
42
-
43
-
44
-
45
-
46
-
47
-
48
-
49
-
50
-
51
-
52
-
53
 |
 |

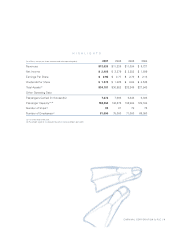
HIGHLIGHTS
(in millions, except per share amounts and other operating data) 2007 2006 2005 2004
Revenues $ 13,033 $ 11,839 $ 11,094 $ 9,727
Net Income $ 2,408 $ 2,279 $ 2,253 $ 1,809
Earnings Per Share $ 2.95 $ 2.77 $ 2.70 $ 2.18
Dividends Per Share $ 1.375 $ 1.025 $ 0.80 $ 0.525
Total Assets(a) $ 34,181 $ 30,552 $ 28,349 $ 27,548
Other Operating Data
Passengers Carried (in thousands) 7,672 7,008 6,848 6,306
Passenger Capacity(a)(b) 158,352 143,676 136,960 129,108
Number of Ships(a) 85 81 79 76
Number of Employees(a) 81,000 75,000 71,000 69,000
(a) As of the end of the year.
(b) Passenger capacity is calculated based on two passengers per cabin.
CARNIVAL CORPORATION & PLC | 1