Carnival Cruises 2007 Annual Report Download - page 10
Download and view the complete annual report
Please find page 10 of the 2007 Carnival Cruises annual report below. You can navigate through the pages in the report by either clicking on the pages listed below, or by using the keyword search tool below to find specific information within the annual report.-
 1
1 -
 2
2 -
 3
3 -
 4
4 -
 5
5 -
 6
6 -
 7
7 -
 8
8 -
 9
9 -
 10
10 -
 11
11 -
 12
12 -
 13
13 -
 14
14 -
 15
15 -
 16
16 -
 17
17 -
 18
18 -
 19
19 -
 20
20 -
 21
21 -
22
-
23
-
24
-
25
-
26
-
27
-
28
-
29
-
30
-
31
-
32
-
33
-
34
-
35
-
36
-
37
-
38
-
39
-
40
-
41
-
42
-
43
-
44
-
45
-
46
-
47
-
48
-
49
-
50
-
51
-
52
-
53
 |
 |

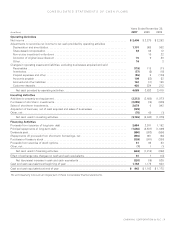
CONSOLIDATED STATEMENTS OF CASH FLOWS
CARNIVAL CORPORATION & PLC | 7
Years Ended November 30,
(in millions) 2007 2006 2005
Operating Activities
Net income ...................................................................... $ 2,408 $ 2,279 $ 2,253
Adjustments to reconcile net income to net cash provided by operating activities
Depreciation and amortization ...................................................... 1,101 988 902
Share-based compensation ........................................................ 64 68 12
Non-cruise investment write-down ................................................. 10 22
Accretion of original issue discount ................................................. 10 9 20
Other ......................................................................... 16 3
Changes in operating assets and liabilities, excluding businesses acquired and sold
Receivables .................................................................... (119) 118 (71)
Inventories ..................................................................... (57) (5) (15)
Prepaid expenses and other ....................................................... (56) 6 (136)
Accounts payable ............................................................... 109 (53) 53
Accrued and other liabilities ....................................................... 163 (11) 155
Customer deposits .............................................................. 430 224 212
Net cash provided by operating activities . . . . . . . . . . . . . . . . . . . . . . . . . . . . . . . . . . . . . . . . . . . 4,069 3,633 3,410
Investing Activities
Additions to property and equipment .................................................. (3,312) (2,480) (1,977)
Purchases of short-term investments. . . . . . . . . . . . . . . . . . . . . . . . . . . . . . . . . . . . . . . . . . . . . . . . . . (2,098) (18) (935)
Sales of short-term investments. . . . . . . . . . . . . . . . . . . . . . . . . . . . . . . . . . . . . . . . . . . . . . . . . . . . . . 2,078 6 943
Acquisition of business, net of cash acquired and sales of businesses . . . . . . . . . . . . . . . . . . . . . . . (339)
Other, net ....................................................................... (75) 49 (1)
Net cash used in investing activities ............................................... (3,746) (2,443) (1,970)
Financing Activities
Proceeds from issuance of long-term debt . . . . . . . . . . . . . . . . . . . . . . . . . . . . . . . . . . . . . . . . . . . . . 2,654 2,241 1,152
Principal repayments of long-term debt ................................................ (1,656) (2,537) (1,096)
Dividends paid .................................................................... (990) (803) (566)
(Repayments of) proceeds from short-term borrowings, net . . . . . . . . . . . . . . . . . . . . . . . . . . . . . . . (330) 661 (58)
Purchases of treasury stock ......................................................... (326) (841) (386)
Proceeds from exercise of stock options ............................................... 51 66 63
Other, net ....................................................................... (7) 1 (1)
Net cash used in financing activities ............................................... (604) (1,212) (892)
Effect of exchange rate changes on cash and cash equivalents . . . . . . . . . . . . . . . . . . . . . . . . . . . . . 61 7 (13)
Net (decrease) increase in cash and cash equivalents ................................. (220) (15) 535
Cash and cash equivalents at beginning of year . . . . . . . . . . . . . . . . . . . . . . . . . . . . . . . . . . . . . . . . . 1,163 1,178 643
Cash and cash equivalents at end of year . . . . . . . . . . . . . . . . . . . . . . . . . . . . . . . . . . . . . . . . . . . . . . $ 943 $ 1,163 $ 1,178
The accompanying notes are an integral part of these consolidated financial statements.