Buffalo Wild Wings 2008 Annual Report Download - page 24
Download and view the complete annual report
Please find page 24 of the 2008 Buffalo Wild Wings annual report below. You can navigate through the pages in the report by either clicking on the pages listed below, or by using the keyword search tool below to find specific information within the annual report.-
 1
1 -
2
-
3
-
4
-
5
-
6
-
7
-
8
-
9
-
10
-
11
-
12
-
13
-
 14
14 -
 15
15 -
 16
16 -
 17
17 -
 18
18 -
 19
19 -
 20
20 -
 21
21 -
 22
22 -
 23
23 -
 24
24 -
 25
25 -
 26
26 -
 27
27 -
 28
28 -
 29
29 -
 30
30 -
 31
31 -
 32
32 -
 33
33 -
 34
34 -
35
-
36
-
37
-
38
-
39
-
40
-
41
-
42
-
43
-
44
-
45
-
46
-
47
-
48
-
49
-
50
-
51
-
52
-
53
-
54
-
55
-
56
-
57
-
58
-
59
-
60
-
61
-
62
-
63
-
64
-
65
-
66
 |
 |

24
The number of company-owned and franchised restaurants open are as follows:
As of
Dec. 28,
2008
Dec. 30,
2007
Dec. 31,
2006
Company-owned restaurants 197 161 139
Franchised restaurants 363 332 290
The restaurant sales for company-owned and franchised restaurants are as follows (in thousands of dollars):
Fiscal Years Ended
Dec. 28,
2008
Dec. 30,
2007
Dec. 31,
2006
Company-owned restaurant sales $ 379,686 $ 292,824 $ 247,150
Franchised restaurant sales 849,753 724,486 621,897
Increases in comparable same-store sales are as follows (based on restaurants operating at least fifteen months):
Fiscal Years Ended
Dec. 28,
2008
Dec. 30,
2007
Dec. 31,
2006
Company-owned same-store sales 5.9% 6.9% 10.4%
Franchised same-store sales 2.8 3.9 6.1
The annual average price paid per pound for fresh chicken wings for company-owned restaurants is as follows:
Fiscal Years Ended
Dec. 28,
2008
Dec. 30,
2007
Dec. 31,
2006
Annual average price per pound $ 1.22 $ 1.28 $ 1.17
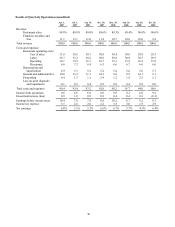
Fiscal Year 2008 Compared to Fiscal Year 2007
Restaurant sales increased by $86.9 million, or 29.7%, to $379.7 million in 2008 from $292.8 million in 2007. The
increase in restaurant sales was due to a $70.6 million increase associated with the opening of 40 new company-owned
restaurants in 2008, which includes eight stores acquired from Avado Brands, Inc. and nine stores acquired from our
franchisee in Nevada, and the 34 company-owned restaurants opened before 2008 that did not meet the criteria for same-store
sales for all, or part, of the year. A 5.9% increase in same-store sales accounted for $16.3 million of the increase in restaurant
sales.
Franchise royalties and fees increased by $5.9 million, or 16.0%, to $42.7 million in 2008 from $36.8 million in 2007.
The increase was due primarily to additional royalties collected from the 46 new franchised restaurants that opened in 2008
and a full year of operations for the 46 franchised restaurants that opened in 2007. Same-store sales for franchised restaurants
increased 2.8%.
Cost of sales increased by $23.2 million, or 25.8%, to $113.3 million in 2008 from $90.1 million in 2007 due primarily
to more restaurants being operated in 2008. Cost of sales as a percentage of restaurant sales decreased to 29.8% in 2008 from
30.8% in 2007. The decrease in cost of sales as a percentage of restaurant sales was primarily due to the leverage of food and
alcohol costs as a result of menu price increases and lower fresh chicken wing prices. Fresh chicken wing costs dropped to
$1.22 per pound in 2008 from $1.28 per pound in 2007. Also, boneless wings sales have increased as a part of our menu mix,
providing better margins and a corresponding lower cost of sales percentage.
Labor expenses increased by $26.8 million, or 30.6%, to $114.6 million in 2008 from $87.8 million in 2007 due
primarily to more restaurants being operated in 2008. Labor expenses as a percentage of restaurant sales increased to 30.2%
in 2008 compared to 30.0% in 2007. Labor costs in our restaurants were higher than prior year due to restaurants having
higher management salaries which were partially offset by lower workers’ compensation costs.
Operating expenses increased by $12.2 million, or 25.5%, to $60.2 million in 2008 from $48.0 million in 2007 due
primarily to more restaurants being operated in 2008. Operating expenses as a percentage of restaurant sales decreased to
15.9% in 2008 from 16.4% in 2007. The decrease in operating expenses as a percentage of restaurant sales was primarily due
to lower repair and maintenance costs and general liability insurance costs offset by higher natural gas hedging cost for future
months.