Boeing 2015 Annual Report Download - page 7
Download and view the complete annual report
Please find page 7 of the 2015 Boeing annual report below. You can navigate through the pages in the report by either clicking on the pages listed below, or by using the keyword search tool below to find specific information within the annual report.-
 1
1 -
 2
2 -
 3
3 -
 4
4 -
 5
5 -
 6
6 -
 7
7 -
 8
8 -
 9
9 -
 10
10 -
 11
11 -
 12
12 -
 13
13 -
 14
14 -
 15
15 -
 16
16 -
 17
17 -
 18
18 -
19
-
20
-
21
-
22
-
23
-
24
-
25
-
26
-
27
-
28
-
29
-
30
-
31
-
32
-
33
-
34
-
35
-
36
-
37
-
38
-
39
-
40
-
41
-
42
-
43
-
44
-
45
-
46
-
47
-
48
-
49
-
50
-
51
-
52
-
53
-
54
-
55
-
56
-
57
-
58
-
59
-
60
-
61
-
62
-
63
-
64
-
65
-
66
-
67
-
68
-
69
-
70
-
71
-
72
-
73
-
74
-
75
-
76
-
77
-
78
-
79
-
80
-
81
-
82
-
83
-
84
-
85
-
86
-
87
-
88
-
89
-
90
-
91
-
92
-
93
-
94
-
95
-
96
-
97
-
98
-
99
-
100
-
101
-
102
-
103
-
104
-
105
-
106
-
107
-
108
-
109
-
110
-
111
-
112
-
113
-
114
-
115
-
116
-
117
-
118
-
119
-
120
-
121
-
122
-
123
-
124
-
125
-
126
-
127
-
128
-
129
-
130
-
131
-
132
-
133
-
134
-
135
-
136
-
137
-
138
-
139
-
140
-
141
-
142
-
143
-
144
-
145
-
146
-
147
-
148
-
149
-
150
-
151
-
152
 |
 |

Total Backlog*
$ in billions
Commercial
Airplane Deliveries
Commercial
Airplanes and
Services Markets
(2015–2024)
$ in billions
Defense, Space &
Security Served
Markets (2015–2024)
$ in billions
11 12 13 14 15 1 2 3 4 5 6 Int’l U.S. Total
Served
355.4
390.2
440.9
502.4
489.3
11 12 13 14 15
477
601
648
723
762
60
120
500
650
1,140
1,250
11 12 13 14 15 11 12 13 14 15
68.7
81.7
86.6
90.8
96.1
11 12 13 14 15
5.79
5.88
7.07
8.60
7.72
4.0
7.5
8.2
8.9
9.4
Revenues
$ in billions
FINANCIAL RESULTS
BUSINESS HIGHLIGHTS
Core Earnings
Per Share†
Operating Cash Flow
$ in billions
COMPARISON OF CUMULATIVE* FIVE-YEAR
TOTAL SHAREHOLDER RETURNS
1 Regional Jets
2 Large Wide-body
3 Medium Wide-body
4 Small Wide-body
5 Single-Aisle
6 Services
1,890
1,150
3,000
Services
Products
Boeing
S&P 500
Index
S&P 500
Aerospace
& Defense
Company/Index
Years Ending December
Base Period
2010
100
100
100
115.20
105.28
102.11
2011
121.23
120.61
118.45
2012
223.96
186.85
156.82
2013
218.30
208.21
178.29
2014 2015
10 11 12 13 14 15
248.97
219.52
180.75
$100
$300
$200
*Cumulative return assumes $100 invested; includes reinvestment of dividends.
The Boeing Company
S&P 500 Aerospace & Defense
S&P 500 Index
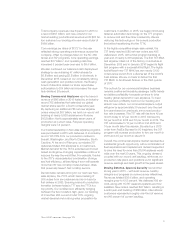
Our backlog remains strong at
$489 billion with net orders of
$83 billion for 2015, as we continued
to focus on productivity and posi-
tioning Boeing to deliver sustained
growth and strong business
performance for years to come.
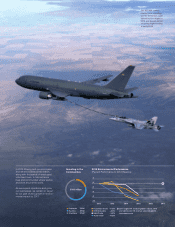
We delivered a record 762 commer-
cial airplanes and grew our services
business while continuing to improve
productivity and quality, prepare the
production system for the transition
to new models, and adjust rates.
Increased production rates, supe-
rior new commercial airplanes and
continued innovation will help keep
Boeing competitive across address-
able markets, valued at $3.7 trillion
over the next 10 years.
With proven products and services
and a commitment to improved
productivity and affordability,
Boeing remains well positioned in
global defense, space and security
markets worth $3.0 trillion over the
next decade.
Revenues in 2015 rose 6 percent
to a record $96.1 billion driven by
record commercial deliveries and
solid performance in our defense,
space and security business.
Core earnings per share reflected
charges for the KC-46A tanker and
747 programs, which were partially
offset by strong core operating
performance across the company.
In 2015, our operating cash flow
continued to grow, supporting a
20 percent increase in our dividend
and a new share repurchase
authorization of $14 billion.
* Total backlog includes contractual and
unobligated backlog. See page 24 of
the Form 10-K.
†Non-GAAP measures. See page 123.
5