Boeing 2013 Annual Report Download - page 10
Download and view the complete annual report
Please find page 10 of the 2013 Boeing annual report below. You can navigate through the pages in the report by either clicking on the pages listed below, or by using the keyword search tool below to find specific information within the annual report.-
 1
1 -
 2
2 -
 3
3 -
 4
4 -
 5
5 -
 6
6 -
 7
7 -
 8
8 -
 9
9 -
 10
10 -
 11
11 -
 12
12 -
 13
13 -
 14
14 -
 15
15 -
 16
16 -
 17
17 -
 18
18 -
 19
19 -
 20
20 -
 21
21 -
22
-
23
-
24
-
25
-
26
-
27
-
28
-
29
-
30
-
31
-
32
-
33
-
34
-
35
-
36
-
37
-
38
-
39
-
40
-
41
-
42
-
43
-
44
-
45
-
46
-
47
-
48
-
49
-
50
-
51
-
52
-
53
-
54
-
55
-
56
-
57
-
58
-
59
-
60
-
61
-
62
-
63
-
64
-
65
-
66
-
67
-
68
-
69
-
70
-
71
-
72
-
73
-
74
-
75
-
76
-
77
-
78
-
79
-
80
-
81
-
82
-
83
-
84
-
85
-
86
-
87
-
88
-
89
-
90
-
91
-
92
-
93
-
94
-
95
-
96
-
97
-
98
-
99
-
100
-
101
-
102
-
103
-
104
-
105
-
106
-
107
-
108
-
109
-
110
-
111
-
112
-
113
-
114
-
115
-
116
-
117
-
118
-
119
-
120
-
121
-
122
-
123
-
124
-
125
-
126
-
127
-
128
-
129
-
130
-
131
-
132
-
133
-
134
-
135
-
136
-
137
-
138
-
139
-
140
-
141
-
142
-
143
-
144
-
145
-
146
-
147
-
148
 |
 |

8
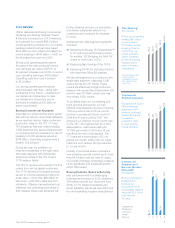
FINANCIAL RESULTS
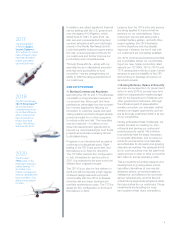
Strong operational
performance, driven
by our relentless focus
on business execution
and ever-increasing
competitiveness, led
to record company
revenues and earnings,
along with increased
cash flow. In summary,
2013 was a milestone
year for Boeing, thanks
to the tremendous
effort of our employees,
our partners and our
customers worldwide.
With a 20 percent
increase in 2013,
we delivered record
core earnings per
share, driven by
strong operational
performance across
the company.
Core Earnings
per Share*
Revenues
($ in billions)
Record deliveries
and strong core
performance
companywide
contributed to a
9 percent increase
in operating
cash flow.
Operating Cash
Flow ($ in billions)
Driven by higher
deliveries across
Commercial
Airplanes and
Defense, Space &
Security, revenues
grew 6 percent from
2012 to a record
$86.6 billion.
12
81.7
11
68.7
10
64.3
09
68.3
13
86.6
12
5.88
11
5.79
10
4.45
09
1.82
13
7.07
12
7.5
11
4.0
10
3.0
09
5.6
13
8.2
* Non-GAAP measure.
See page 122.
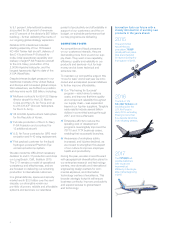
The Boeing Company
S&P 500 Aerospace & Defense
S&P 500 Index
Comparison of Cumulative‡
Five-Year Total Shareholder Returns
‡ Cumulative return assumes $100 invested;
includes reinvestment of dividends.
Boeing
S&P 500
Index
S&P 500
Aerospace
& Defense
Company/
Index
Years Ending December
Base
Period
2008
100
100
100
131.72
124.64
126.47
2009
162.79
143.47
145.52
2010
187. 54
151.05
148.59
2011
197. 36
173.04
172.36
2012 2013
364.61
268.08
228.17
$100
$400
$300
$200
0908 10 11 12 13