Blizzard 2014 Annual Report Download - page 2
Download and view the complete annual report
Please find page 2 of the 2014 Blizzard annual report below. You can navigate through the pages in the report by either clicking on the pages listed below, or by using the keyword search tool below to find specific information within the annual report.-
 1
1 -
 2
2 -
 3
3 -
 4
4 -
 5
5 -
 6
6 -
 7
7 -
 8
8 -
 9
9 -
 10
10 -
 11
11 -
 12
12 -
 13
13 -
14
-
15
-
16
-
17
-
18
-
19
-
20
-
21
-
22
-
23
-
24
-
25
-
26
-
27
-
28
-
29
-
30
-
31
-
32
-
33
-
34
-
35
-
36
-
37
-
38
-
39
-
40
-
41
-
42
-
43
-
44
-
45
-
46
-
47
-
48
-
49
-
50
-
51
-
52
-
53
-
54
-
55
 |
 |

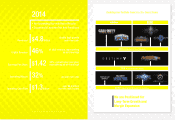
2014
n An Outstanding Year with Record Results
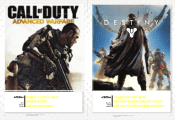
n Successfully Launched Two New Franchises
Revenues1 $4.8billion
Digital Revenue1 46%
Earnings Per Share1 $1.42
Operating Margin1 32%
Operating Cash Flow $1.3 billion
double digit growth
year over year
of total revenue, representing
an all-time high
50%+ growth year over year,
representing an all-time high
up year over year
over $6.2 billion
over the last 5 years
1Non-GAAP; for a full reconciliation, please see tables at the end of the annual report.
1
We are Positioned for
Long-Term Growth and
Margin Expansion
Unannounced
Initiatives ▲
▲
▲
▲
▲
▲
▲
▲
®
®
2014 Launched 2 New Games
2015 Expect to End 2015 with 10+ Franchises
Doubling Our Portfolio from 5 to 10+ Over 2 Years
▲
▲
▲
2013 Ended with 5 Core Franchises
▲
▲
▲