Blizzard 2002 Annual Report Download - page 9
Download and view the complete annual report
Please find page 9 of the 2002 Blizzard annual report below. You can navigate through the pages in the report by either clicking on the pages listed below, or by using the keyword search tool below to find specific information within the annual report.-
 1
1 -
 2
2 -
 3
3 -
 4
4 -
 5
5 -
 6
6 -
 7
7 -
 8
8 -
 9
9 -
 10
10 -
 11
11 -
 12
12 -
 13
13 -
 14
14 -
 15
15 -
 16
16 -
 17
17 -
 18
18 -
 19
19 -
 20
20 -
21
-
22
-
23
-
24
-
25
-
26
-
27
-
28
 |
 |

14/15
Net Revenues. Net revenues for the year ended March 31, 2002 increased 27% from the prior fiscal year,
from $620.2 million to $786.4 million. This increase was driven by the performance of both our publishing
segment and our distribution segment.
Publishing net revenues for the year ended March 31, 2002 increased 18% from $466.1 million to $549.5
million. This increase primarily was due to publishing console net revenues increasing 24% from $349.5
million to $432.2 million. The increase in publishing console net revenues was attributable to the release
in fiscal 2002 of several titles for next-generation platforms that sold very well in both the domestic and
international marketplaces, as well as continuing strong worldwide sales for titles released on existing plat-
forms. Such titles included Tony Hawk’s Pro Skater 3 for PS2, GameCube and PS1, Tony Hawk’s Pro Skater 2
for GBA, N64 and PS1, Wreckless: The Yakuza Missions for Xbox, as well as Mat Hoffman’s Pro BMX for PS1,
GBA and GBC. A significant portion of our revenues is derived from products based on a relatively small
number of popular brands each year. In fiscal 2002, 50% of our worldwide net publishing revenues (35% of
consolidated net revenues) was derived from two brands, one of which accounted for 44% and the other of
which accounted for 6% of worldwide net publishing revenues (31% and 4%, respectively, of consolidated
net revenues). In fiscal 2001, two brands accounted for 49% of our worldwide net publishing revenues (37%
of consolidated net revenues), one of which accounted for 39% and the other of which accounted for 10%
of worldwide net publishing revenues (29% and 8%, respectively, of consolidated net revenues). We expect
that a limited number of popular brands will continue to produce a disproportionately large amount of our
revenues. In fiscal 2002, 56% of publishing console net revenues were derived from sales of titles for next-
generation platforms while 44% were derived from sales of titles for existing platforms. When new console
platforms are announced or introduced into the market, consumers typically reduce their purchases of game
console entertainment software products for current console platforms in anticipation of new platforms
becoming available. We expect sales from existing generation platform titles to decline and sales from next-
generation platform titles to increase as the installed base of next-generation platforms grows. Publishing
PC net revenues for the year ended March 31, 2002 remained relatively consistent with the prior year,
increasing from $116.5 million to $117.3 million. Our PC business was flat primarily due to the fact that,
despite the successful launch of Return to Castle Wolfenstein for the PC in the third quar ter of fiscal 2002,
there was a lower number of premium PC titles released in the year ended March 31, 2002, as compared
to the year ended March 31, 2001.
Distribution net revenues for the year ended March 31, 2002 increased 54% from the prior fiscal year,
from $154.1 million to $236.9 million, primarily driven by an increase in our distribution console net
revenues. Distribution console net revenues for the year ended March 31, 2002 increased 77% over the
prior fiscal year, from $117.4 million to $207.6 million. We are the sole distributor of Sony products in the
independent channel in the United Kingdom (“UK”). Accordingly, we benefited from the price reduction
on PS2 hardware that was effective September 2001, as this resulted in both an increase in sales of PS2
hardware, as well as an increase in sales of PS2 software due to the corresponding larger installed hardware
base. Additionally, in fiscal 2002, we began distributing Nintendo products within the UK. These items,
along with the improved market conditions in Europe, have resulted in the continued improvements in our
distribution business.
Domestic net revenues grew 15% from $352.9 million to $404.9 million. International net revenues
increased by 43% from $267.3 million to $381.5 million. The increase in domestic net revenues is reflective
of the improvements in our publishing segment as described above, and the increase in international net
revenues is reflective of the improvements in our publishing and distribution segments as described above.
Costs and Expenses. Cost of sales—product costs represented 56% and 52% of consolidated net revenues for
the year ended March 31, 2002 and 2001, respectively. The increase in cost of sales—product costs as a
percentage of consolidated net revenues for the year ended March 31, 2002 was due to the increase in
distribution net revenues as a percentage of total consolidated net revenues, as well as a change in the
product mix of our publishing business. Distribution net revenues have a higher per unit cost as compared
to publishing net revenues. The product mix of our publishing business for the year ended March 31, 2002
reflects a heavier concentration of console products and hand held devices. Console products generally
have a higher manufacturing per unit cost than PCs. Hand held devices generally have the highest manufac-
turing per unit cost of all platforms.
Cost of sales—intellectual property licenses decreased as a percentage of publishing net revenues to 7% for
the year ended March 31, 2002, from 9% for the year ended March 31, 2001. The decrease is reflective of
We evaluate the future recoverability of capitalized amounts on a quarterly basis. The recoverability of
capitalized intellectual proper ty license costs is evaluated based on the expected performance of the
specific products in which the licensed trademark or copyright is used. The following criteria is used to
evaluate expected product performance: historical performance of comparable products; the commercial
acceptance of prior products released on a given game engine; orders for the product prior to its release;
estimated performance of a sequel product based on the performance of the product on which the sequel
is based; and actual development costs of a product as compared to our budgeted amount.
Commencing upon the related product’s release, capitalized intellectual property license costs are
amortized to cost of sales—intellectual property licenses based on the ratio of current revenues to total
projected revenues. For products that have been released, we evaluate the future recoverability of capital-
ized amounts on a quarterly basis. The primary evaluation criterion is actual title performance.
Significant management judgment and estimates are utilized in the assessment of the recoverability of
capitalized costs.
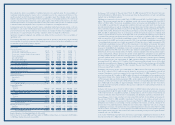
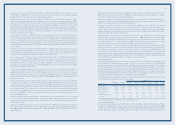
The following table sets forth certain consolidated statements of operations data for the periods indicated
as a percentage of total net revenues and also breaks down net revenues by territory and platform, as well
as operating income (loss) by business segment:
Fiscal years ended March 31, (In thousands) 2002 2001 2000
Net revenues $786,434 100% $620,183 100% $572,205 100%
Costs and expenses:
Cost of sales—product costs 435,725 56 324,907 52 319,422 56
Cost of sales—intellectual proper ty licenses 40,114 5 39,838 6 49,174 9
Cost of sales—software royalties and amortization 58,892 7 49,864 8 42,064 7
Product development 40,960 5 41,396 8 26,275 5
Sales and marketing 86,161 11 85,378 14 87,303 15
General and administrative 44,008 6 37,491 6 36,674 6
Amortization of intangibles — — 1,502 — 41,618 7
Total costs and expenses 705,860 90 580,376 94 602,530 105
Income (loss) from operations 80,574 10 39,807 6 (30,325) (5)
Interest income (expense), net 2,546 1 (7,263) (1) (8,411) (2)
Income (loss) before income tax provision 83,120 11 32,544 5 (38,736) (7)
Income tax provision (benefit) 30,882 4 12,037 2 (4,648) (1)
Net income (loss) $ 52,238 7% $ 20,507 3% $ (34,088) (6%)
Net Revenues by Territory:
United States $404,905 51% $352,893 57% $282,847 49%
Europe 368,799 47 256,228 41 277,485 49
Other 12,730 2 11,062 2 11,873 2
Total net revenues $786,434 100% $620,183 100% $572,205 100%
Segment/Platform Mix:
Publishing:
Console $432,163 79% $349,528 75% $281,204 71%
PC 117,345 21 116,534 25 115,487 29
Total publishing net revenues 549,508 70 466,062 75 396,691 69
Distribution:
Console 207,574 88 117,365 76 129,073 74
PC 29,352 12 36,756 24 46,441 26
Total distribution net revenues 236,926 30 154,121 25 175,514 31
Total net revenues $786,434 100% $620,183 100% $572,205 100%
Operating Income (Loss) by Segment:
Publishing $ 68,675 9% $ 35,687 5% $ (35,049) (6%)
Distribution 11,899 1 4,120 1 4,724 1
Total operating income (loss) $ 80,574 10% $ 39,807 6% $ (30,325) (5%)
Results of Operations—Fiscal Years Ended March 31, 2002 and 2001
Net income for fiscal year 2002 was $52.2 million or $0.88 per diluted share, as compared to $20.5 million
or $0.50 per diluted share in fiscal year 2001.