Black & Decker 2014 Annual Report Download - page 10
Download and view the complete annual report
Please find page 10 of the 2014 Black & Decker annual report below. You can navigate through the pages in the report by either clicking on the pages listed below, or by using the keyword search tool below to find specific information within the annual report.-
 1
1 -
 2
2 -
 3
3 -
 4
4 -
 5
5 -
 6
6 -
 7
7 -
 8
8 -
 9
9 -
 10
10 -
 11
11 -
 12
12 -
 13
13 -
 14
14 -
 15
15 -
 16
16 -
 17
17 -
 18
18 -
 19
19 -
 20
20 -
 21
21 -
22
-
23
-
24
-
25
-
26
-
27
-
28
-
29
-
30
-
31
-
32
-
33
-
34
-
35
-
36
-
37
-
38
-
39
-
40
-
41
-
42
-
43
-
44
-
45
-
46
-
47
-
48
-
49
-
50
-
51
-
52
-
53
-
54
-
55
-
56
-
57
-
58
-
59
-
60
-
61
-
62
-
63
-
64
-
65
-
66
-
67
-
68
-
69
-
70
-
71
-
72
-
73
-
74
-
75
-
76
-
77
-
78
-
79
-
80
-
81
-
82
-
83
-
84
-
85
-
86
-
87
-
88
-
89
-
90
-
91
-
92
-
93
-
94
-
95
-
96
-
97
-
98
-
99
-
100
-
101
-
102
-
103
-
104
-
105
-
106
-
107
-
108
-
109
-
110
-
111
-
112
-
113
-
114
-
115
-
116
-
117
-
118
-
119
-
120
-
121
-
122
-
123
-
124
-
125
-
126
-
127
-
128
-
129
-
130
-
131
-
132
-
133
-
134
-
135
-
136
-
137
-
138
-
139
-
140
-
141
-
142
-
143
-
144
-
145
-
146
-
147
-
148
 |
 |

Stanley Black & Decker 2014 Annual ReportStanley Black & Decker Annual Report
10 11 14
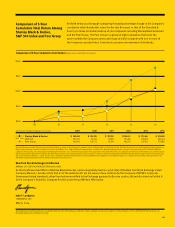
$5.37 $5.67
$4.98
$4.72
$3.54
$3.28
$2.75
12 13
$3.60
$1.01
$4.65
MILLIONS OF DOLLARS
Net earnings from continuing operations $ $ $ $ $
Interest income
Interest expense
Income taxes
Depreciation and amortization
EBITDA from continuing operations $ , $ , $ , $ , $
Merger and acquisition-related charges 442 227 478
Adjusted EBITDA $ , $ , $ , $ , $ ,
(b), (c), (d), (e) and (f) refer to the inside back cover.
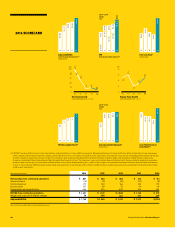
2010–2014
CAGR:
11%
Adjusted EBITDA
(Continuing Operations)(a)
$ MILLIONS
Working Capital Turns(d)
Free Cash Flow(c)
$ MILLIONS
Cash Flow Return on
Investment(f)
2010–2014
CAGR:
12%
EPS
(Continuing Operations)(b)
Average Capital Employed(e)
$ BILLIONS
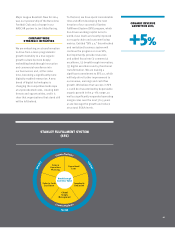
Total Sales Growth
LONGTERM OBJECTIVE: +%
Organic Sales Growth
LONGTERM OBJECTIVE: +%
(a) “EBITDA” (earnings before interest, taxes, depreciation, and amortization) is a non-GAAP measurement. Management believes it is important for the ability to determine the earnings power
of the Company and to properly value the Company, due to high levels of non-cash expenses related to recent acquisitions. The Company’s 2014 results exclude $54 million (pretax) of charges
related to merger and acquisition-related charges. The Company’s 2013 results exclude $390 million (pretax) of charges related to merger and acquisition-related charges as well as the
charges associated with the extinguishment of debt during the fourth quarter of 2013. The Company’s 2012 results exclude $442 million (pretax) of charges related to merger and acquisition-
related charges, the charges associated with the $200 million in cost actions implemented in 2012, as well as the charges associated with the extinguishment of debt during the third quarter
of 2012. In 2011 and 2010, EBITDA excludes pretax merger and acquisition-related charges of $227 million and $478 million, respectively, primarily associated with the Black & Decker merger
and Niscayah acquisitions.
14
$1,745
13
$1,560
12
$1,510
10
$1,053
11
$1,372
14
$1,005
13
$528
12
$593
10
$557
11
$706
SCORECARD
9.2
8.1
7.8
5.9
7.3
14131210 11
$10.7
$7.0
$10.5
$10.4
$10.7
14131210 11 14
13.1%
13
.%
.%
.%
.%
20
(%)
120
11 12 13 14
4%
117%
26%
7%
9%
30
2
6
4
(%)
8
11 12 13 14
5%
5%
6%
2%
3%